An addendum to our risk analysis of tBTC with updated data
#Addendum to Collateral Risk Assessment - Threshold BTC (tBTC)
Update No: 1 | May 13th, 2024
Referenced Report: Collateral Risk Assessment- tBTC | November 1, 2023
The following addendum references the Llama Risk assessment of tBTC published on November 1st, 2023. This update report presents the latest insights and developments from the initial risk assessment of tBTC as of May 13th, 2024.
Our review will follow the same format as the one set out in the initial report. Sections and subsections that saw relevant changes are presented.
This update is prepared for the Aave DAO in the context of the [ARFC for onboarding tBTC to Aave v3]( ARFC for onboarding tBTC to Aave v3) on Ethereum, Arbitrum, and Optimism. Below are the key changes since we published the report.
Useful links
-
Website: [tBTC Bridge App](tBTC Bridge App)
-
Documentation: tBTC Docs | Audits | Keep GitHub
-
Contracts: Mainnet Deployments
-
Markets: Curve tBTC/WBTC | Curve crvUSD/wstETH/tBTC | Uniswap V3's tBTC/WTBC pool
-
Dashboards: DeFiLlama | tBTCScan | Curvemonitor crvUSD tBTC Market | tBTC liquidity | tBTC dashboard
#Section 1: Protocol Fundamentals
#1.1 Description of the Protocol
#1.1.3 Provider Fee
The original report referenced a proposal for T governance token buybacks from treasury funds, which had been approved but had yet to be implemented.
T token buybacks are now active (see TIP 54). Accrued tBTC fees are periodically deposited into a T/tBTC pool. Currently, this process is manual and handled by the Treasury Guild (0x71e47a4429d35827e0312aa13162197c23287546):
-
Initial seed transaction (November 10th, 2023)
-
Example of a single sided deposit (December 4th, 2023)
#Section 2: Performance Analysis
#2.1 Usage Metrics
#2.1.1 Total Value Locked (TVL)
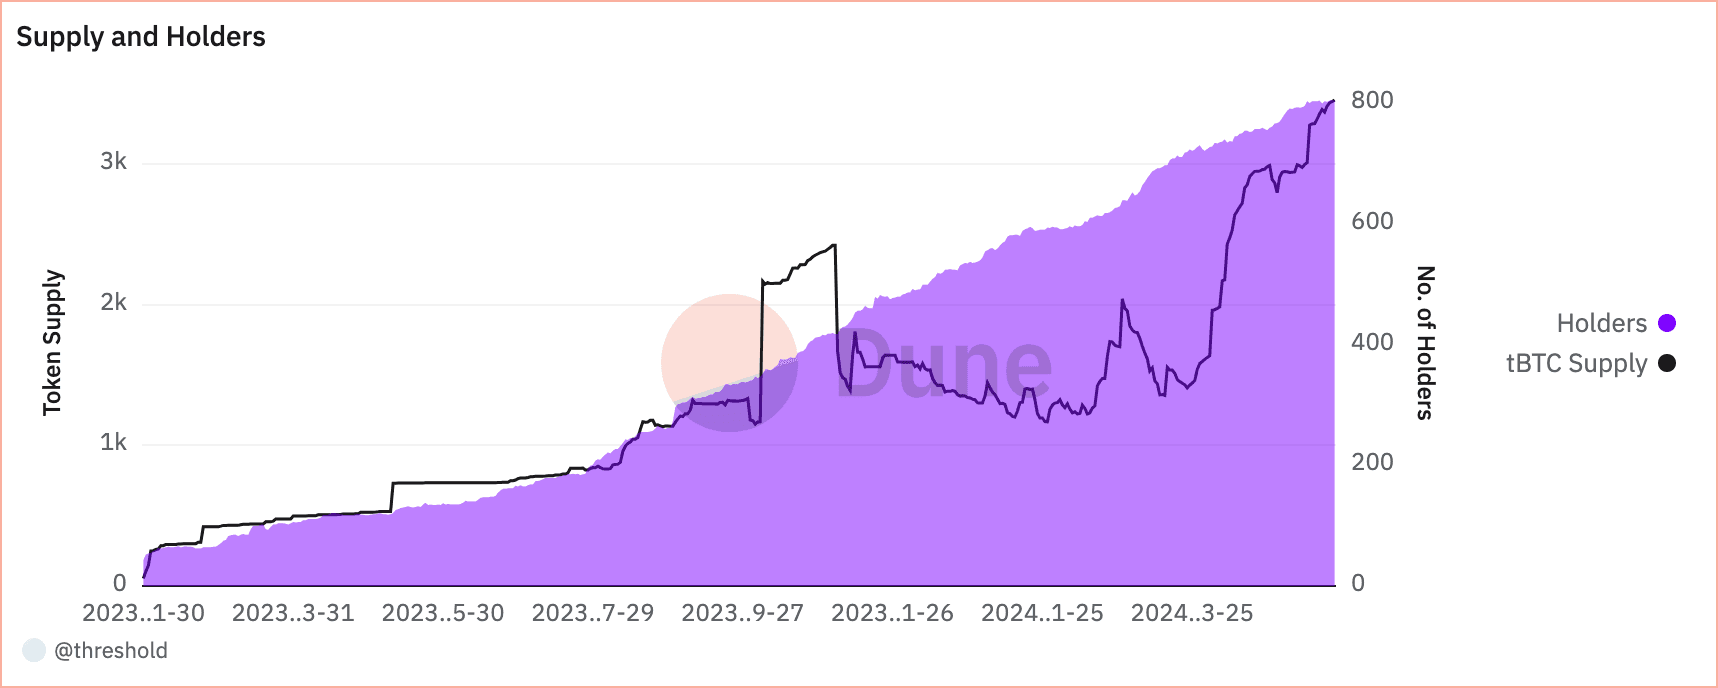
tBTC has experienced periods of sharp volatility in the token supply since our original report. TVL saw a pullback from November until early April, when supply surged. The supply is currently at an all-time high, at over 3,285 tBTC as of May 13th, 2024.
Source: Dune Analytics
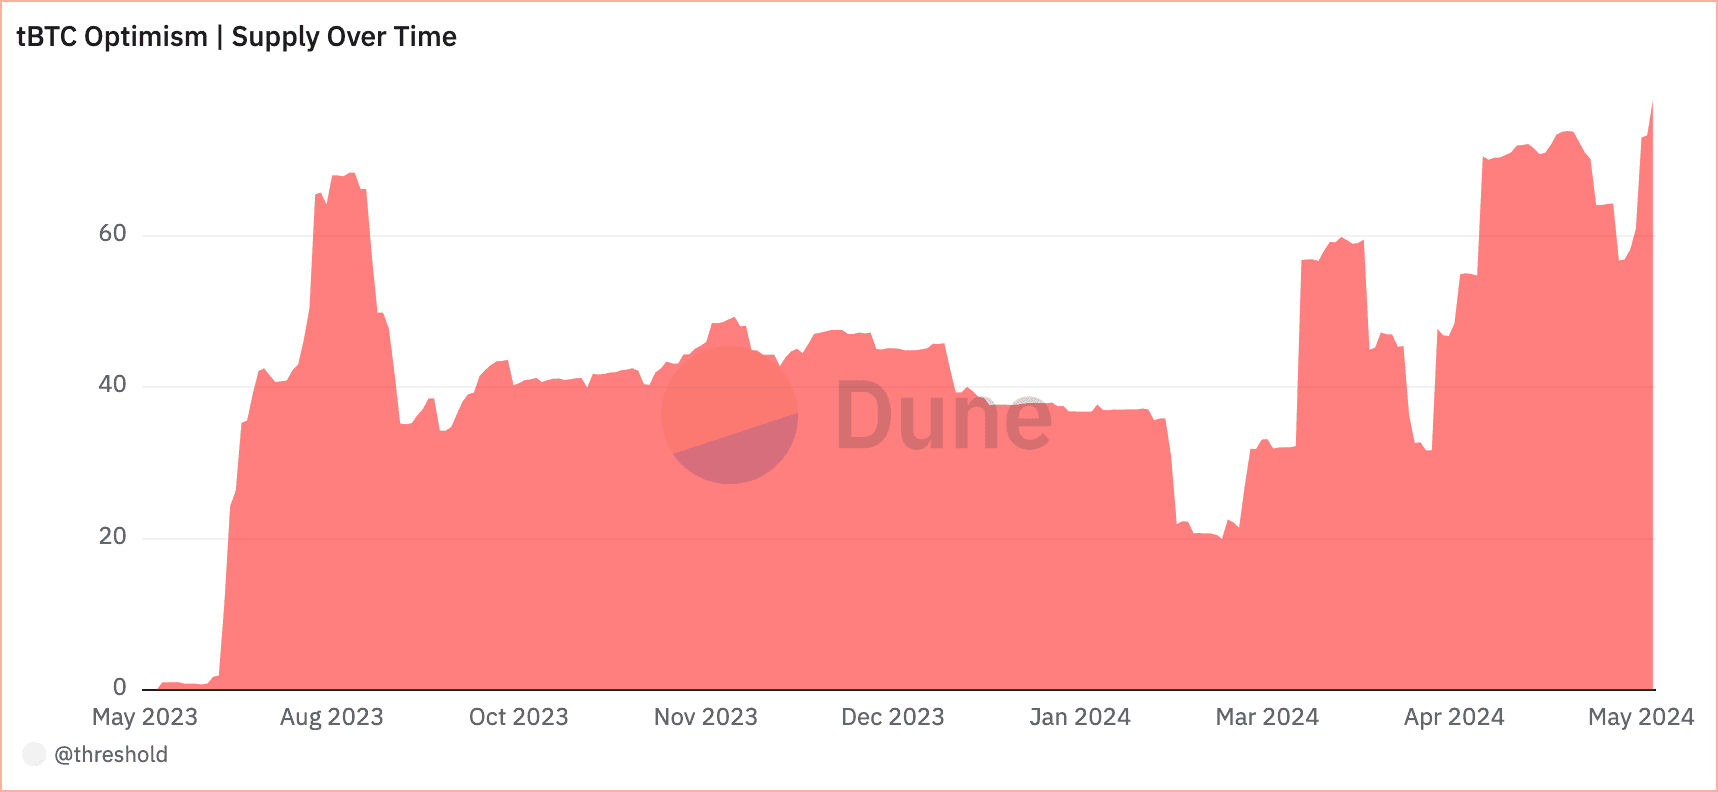
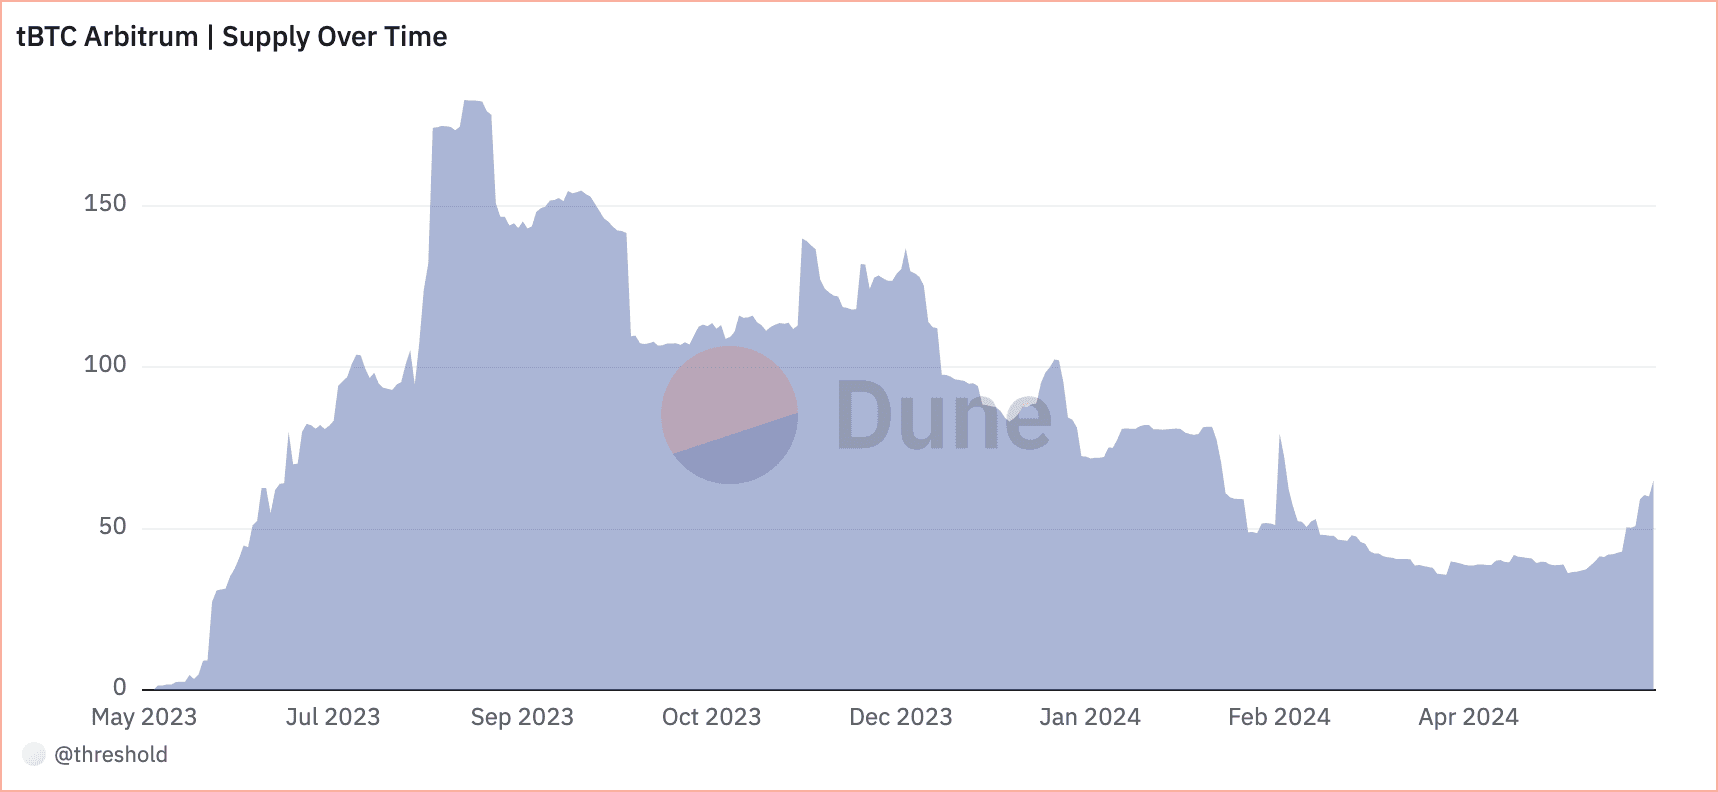
Most tBTC remains the Ethereum mainnet, with marginal adoption on Arbitrum, Optimism, Polygon, Base, and Solana.

Source: tBTC dashboard - May 13th, 2024
@lrsaturninowithDune
@lrsaturninowithDune
#2.1.2 Transaction Volume
tBTC has seen a recent spike in daily on-chain transactions, peaking at 538 tx/day on April 11th, 2024. Daily transfers had been trending upward as of our original report, with ~108 average daily transfers. The 30-day MA similarly increased over the last month, from 86 to 238 daily transfers.
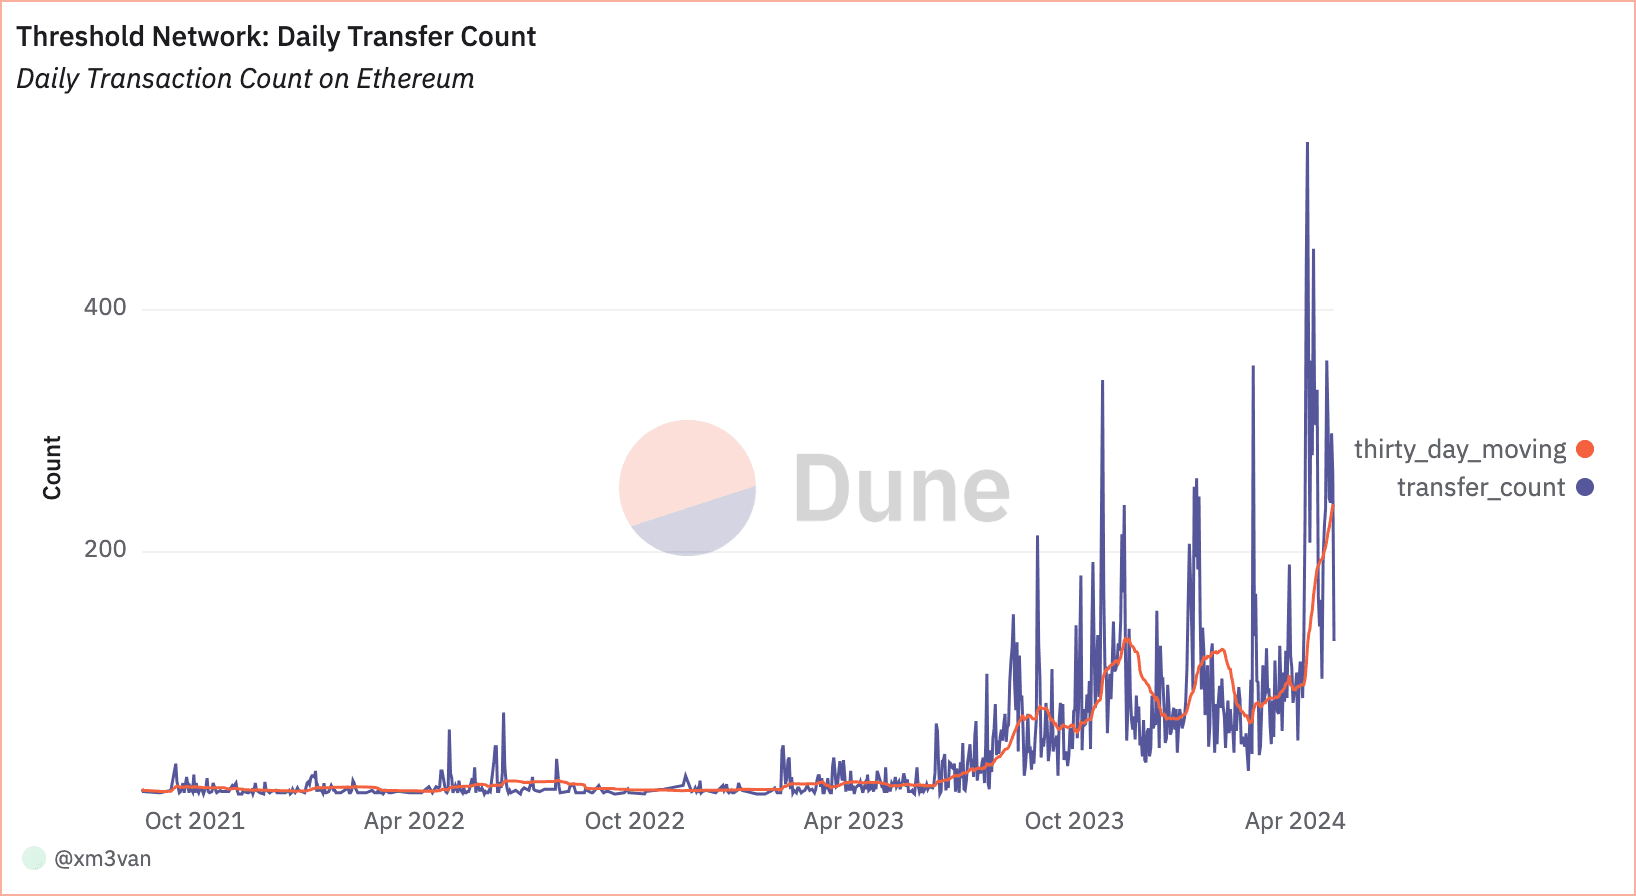
Source: Threshold Network: Daily Transfer Count
#2.1.3 DEX Volume
Most of the volume is observed on the Ethereum mainnet.
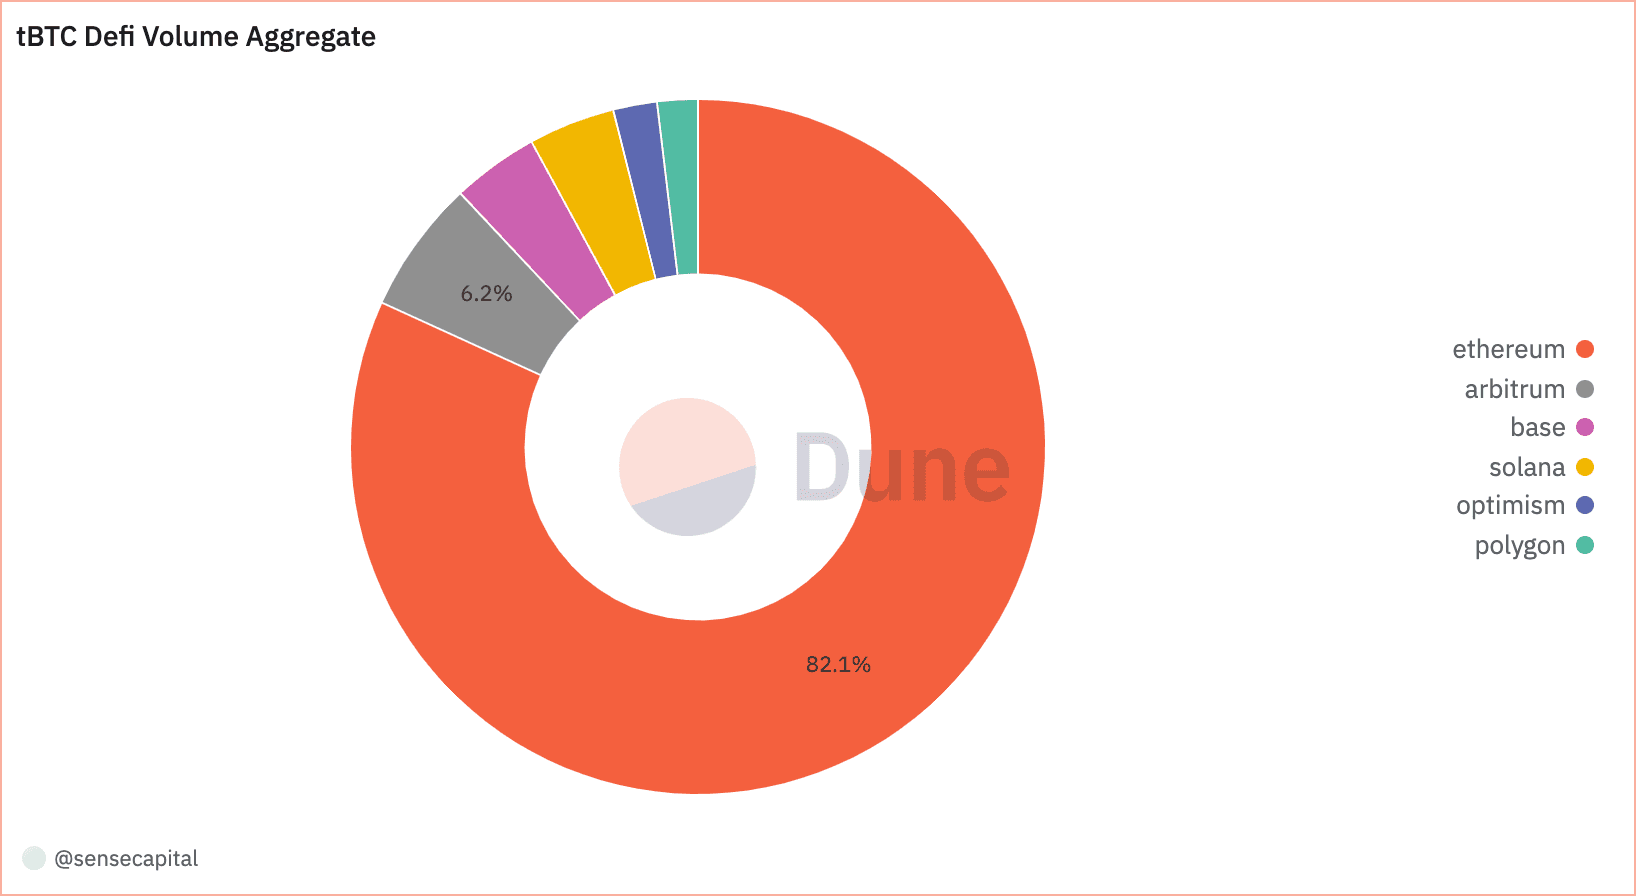
Source: Dune Analytics
As shown below, daily trading volumes briefly regained historic levels. Volume increased in late 2023 and reached a peak level in February 2024. This coincides with BTC breaking historic prices around this time.
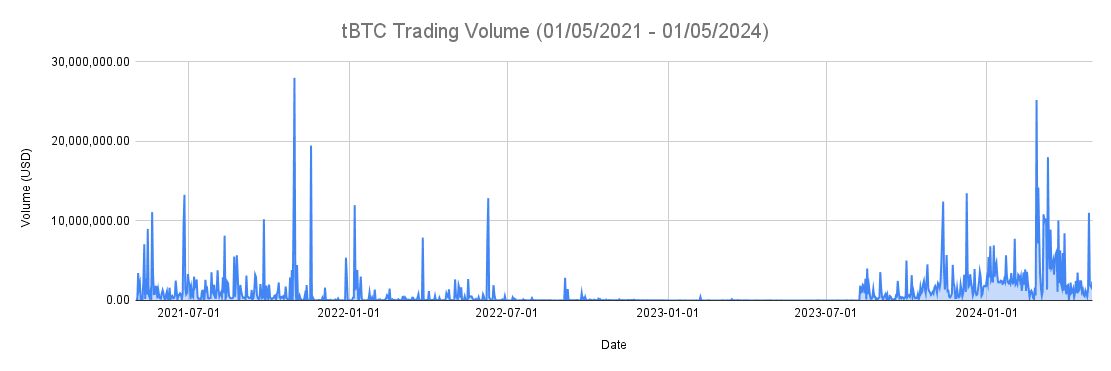
Source: Coingecko - tBTC USD (05/01/2021 - 05/01/2024)
Relative to the initial analysis period (Oct - Nov 2023), daily volume spiked between Feb - March 2024 but has since declined to the initial levels, as shown below. The overall trend has been relatively flat (indicated by the orange trend line).
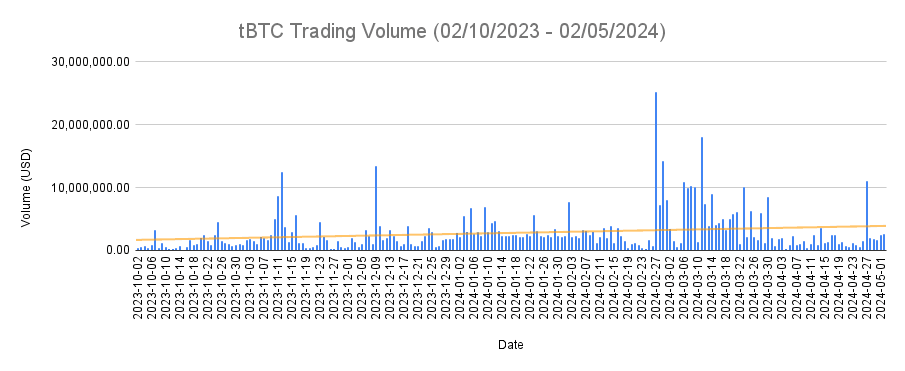
Source: Coingecko - tBTC USD (10/02/2023 - 05/02/2024)
#2.1.4 Average Transaction Size
The average transaction size in USD and tBTC has experienced several phases since our November report. Transaction sizes were mostly stable until beginning to increase in mid-January. Transaction sizes peaked in mid-March and have since declined. The recent decline notably coincides with a sharp supply and transaction volume increase beginning in mid-March.

Source: Average Transfer Size (USD)Threshold Network: Average Transfer Size

Source: Average Transfer Size (tBTC)Threshold Network: Average Transfer Size
#2.1.5 On-chain Transaction Volume to Market Capitalization Ratio
The Trading-Volume-to-Market-Capitalization Ratio (a.k.a. Turnover Ratio) is a financial metric used to normalize analysis of trading activity. Generally, a high vol-to-mcap ratio suggests high liquidity and high market interest.

Source: Volume to Market Capitalization Ratio
While overall displaying high volatility, the value has been relatively stable between early January and mid-April, indicating sustained market demand and an active arbitrage market.
#2.1.6 Token Velocity
Token velocity measures the rate at which a token is circulated or used within a given period. It provides insights into the token's activity and how frequently it changes hands in the market.
The chart below depicts the Token Velocity of tBTC for a 90-day interval (i.e., Token Velocity = Daily Transaction Volume / Average 90-day Market Capitalization).

Source: Token Velocity tBTC
Between January and mid-April, the velocity held a higher baseline level and overall lower volatility, except for a few days in February and March.
#2.1.7 Daily Active Addresses (DAA)
We define an active user as a unique address interacting with the tBTC v2 token contract over 24 hours.

Source: Daily Active Addresses (tBTC)Threshold Network: Daily Transfer Count
Our original report noted that the number of unique tBTC users had increased substantially since redemptions were activated in July 2023. DAAs have experienced an uptick in mid-February, albeit with a less dramatic increase.
#2.1.8 User Growth
tBTC has seen meaningful user growth, with the number of unique holders increasing from ~400 as of our original report to nearly 800. This figure has continued to climb even as the overall tBTC TVL has experienced volatility to the downside between November and April.

Source: Cumulative tBTC Holders
#2.1.9 DeFi Integrations
The composition of the top token holders has changed significantly since our initial report. The top 3 holders include the Mezo lock contract (0xAB13B8eecf5AA2460841d75da5d5D861fD5B8A39), and unknown whale EOA (0x84eA3907b9206427F45c7b2614925a2B86D12611), and the Versus bridge delegator (0x71518580f36FeCEFfE0721F06bA4703218cD7F63)
Mezo is a Bitcoin L2 developed using tBTC. All deposits in Mezo are held in a locking contract that holds funds until they can be bridged at Mezo mainnet launch. The locking contract holds wBTC and tBTC and will enable withdrawal of the original deposited currency (including BTC for BTC deposits) when deposits unlock.

Source: Cumulative Deposits in BTC broken down by Assets
BTC deposits are bridged to tBTC before being deposited in the locking contract (as of 05/14/2024: the locking contract reflects ~622 tBTC; this is a reflection of 302.38 tBTC ordinary deposit + 320.78 BTC converted into tBTC). The locking contract is upgradeable by the 5-of-9 multisig run by Mezo's development team. These upgrades will include additional collateral and enable bridging at launch. The multisig does not retain the funds.
Verus is a blockchain with a trustless bridge. The intended integration with tBTC is detailed in this blog post. The current status of this project is unknown.
Other notable DeFi integrations remain the Curve and Uniswap V3 Pools and Convex staking vaults:
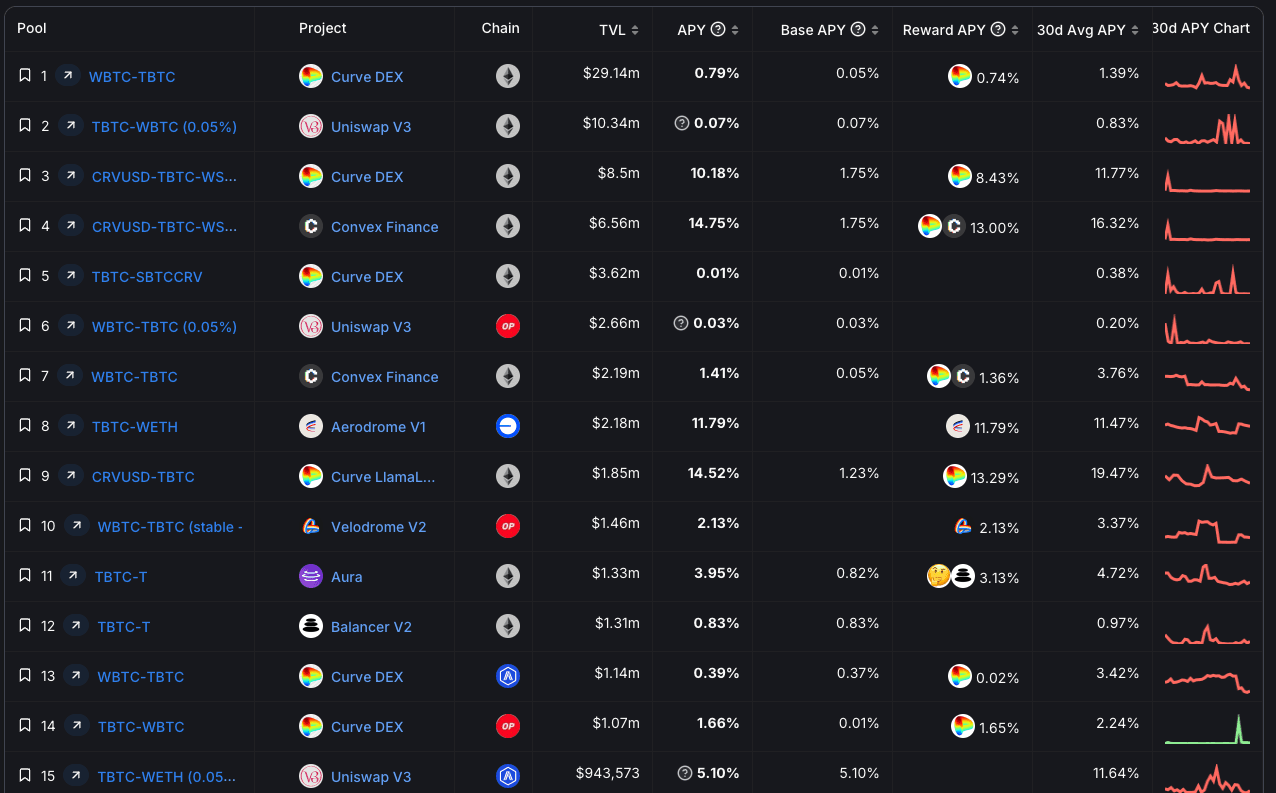
Source: DefiLlama, May 13th, 2024
#2.1 Competitive Analysis Metrics
#2.2.1 Market Share
tBTC remains a small subset of tokenized BTC on Ethereum, with ~2% of the overall market share. The overall BTC market on Ethereum has stagnated since our original report.

Source: Threshold Network: Market Share based on Token Supply
The tBTC market share of tokenized BTC peaked at the time of our original report and declined to 0.7%. It has rebounded recently to an all-time high of 2% as of May 13th, 2024.

Source: Threshold Network: Market Share based on Token Supply
#Section 3: Market Risk
#3.1 Volatility Analysis
#3.1.1 Closeness-to-Underlying Basis
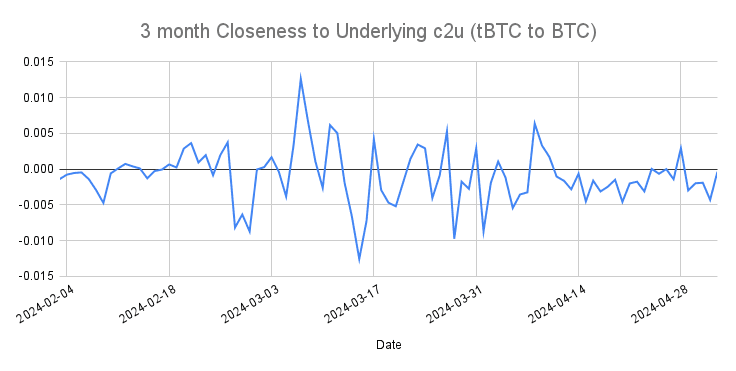
The "Closeness to Underlying" (C2U) metric measures the difference between the closing price of a synthetic asset and its underlying asset, such as tBTC, compared to BTC. The closing prices from CoinGecko between February 4th, 2024, and May 3rd, 2024, were used for this measurement.
Source: Coingecko - BTC & tBTC Historic Data
Over 3 months, on average, tBTC tended to close approximately 0.095% lower than BTC. The most significant negative deviation observed during this period was approximately -0.0125, while the most significant positive deviation was around 0.0126.
Compared to the initial analysis, which had an average close of -0.1145% lower than BTC and a difference range between -0.0152 and 0.0121, c2u has remained relatively constant.
#3.1.2 Relative Volatility
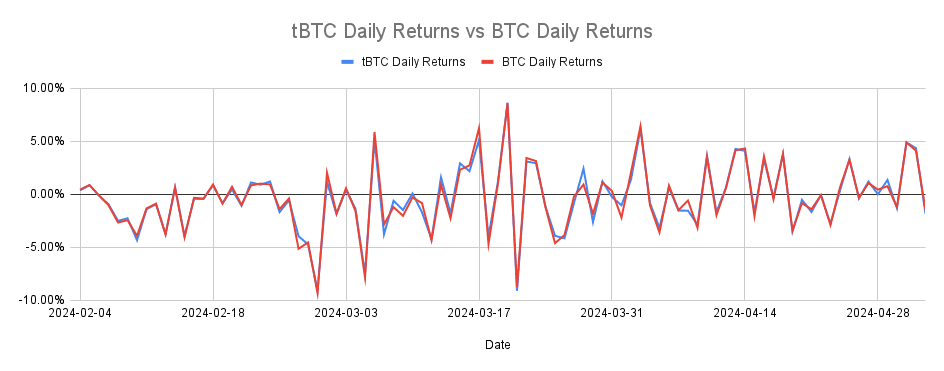
Below is a graph of the daily returns of tBTC relative to spot market BTC over 90 days. Daily returns calculate the difference between the closing price of an asset on one day and the closing price on the previous day. Average daily returns assess the volatility of an asset over time.
The average daily volatility for tBTC was 3.05%, while BTC was 3.13%. It indicated a similar market trend of tBTC relative to its underlying BTC.
Source: Coingecko - BTC & tBTC Historic Data
#3.2 Liquidity Analysis
#3.2.1 Supported DEXs and CEXs
Kraken remains the only active CEX exchange but shows very little daily volume.

Source: Messari, May 13th, 2024
tBTC DEX presence has increased since the initial analysis. At the time of our original report, tBTC had a presence across various DEX pools, including Curve, Uniswap V3, Balancer, Velodrome, Aerodrome, and Orca, with the heaviest concentration on Ethereum-based Curve pools. As of this addendum, the main liquidity venue remains Curve, although Uniswap V3's tBTC/WTBC pool has grown in use.
Curve pool liquidity is concentrated in the tBTC/WBTC stableswap pool and crvUSD/tBTC/wstETH TriCrypto pool.
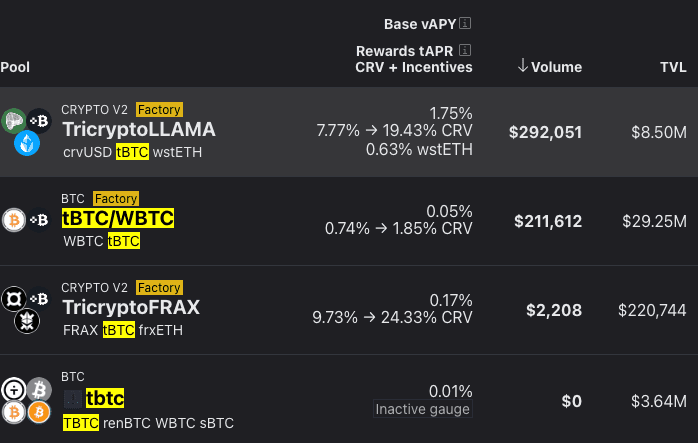
Source: Curve, May 13th, 2024
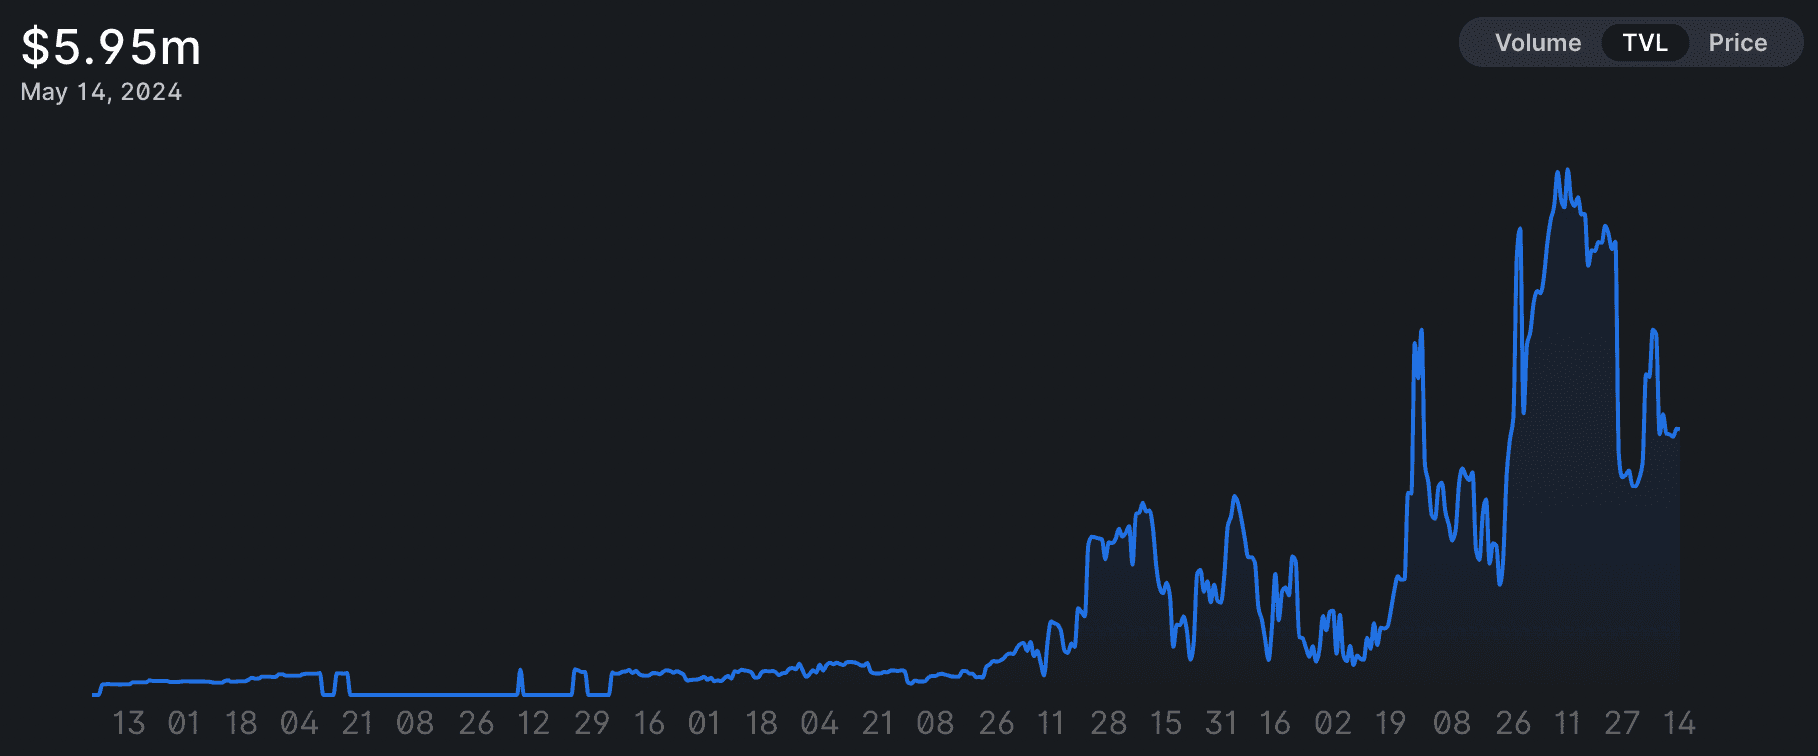
The tBTC/WBTC UniV3 pool has grown since our original report from ~$1m TVL to nearly $6m TVL.
Source: Uniswap V3, May 13th, 2024
With the increased activity on L2 chains, volumes from DEX such as Aerodrome (Base), Velodrome (Optimism), QuickSwap (Polygon), and Orca (Solana) can be observed:

Source: tBTC Defi Volume Aggregate
#3.2.2 Token On-chain Liquidity
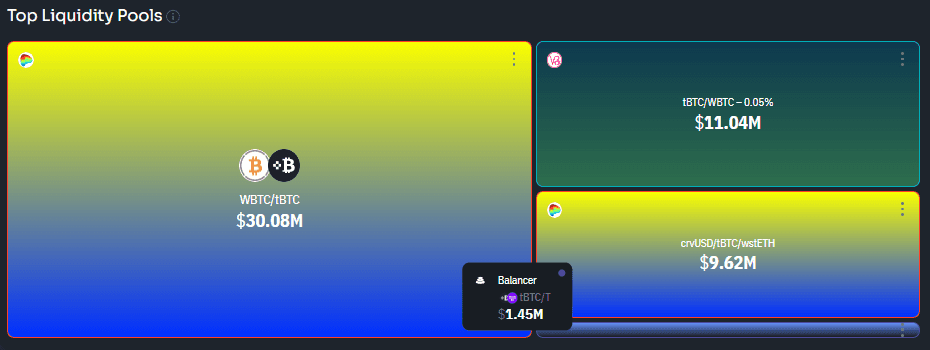
Liquidity reported by DEX Guru amounted to 27.9M USD (as of May 3rd, 2024), a ~50% increase from 18.6M USD found in our original report. Mainnet liquidity remained primarily in Uniswap, Curve, and Balancer.
Source: DexGuru - May 3rd, 2024
Additionally, TVL has increased in the three main pools with over 9M USD. Curve and Uniswap wBTC/tBTC pools have grown significantly since the initial report, while the crvUSD/tBTC/wstETH pool has declined.
Looking at the proportional split of liquidity, Curve represents the majority of DeFi volume at approximately 64.5% (May 4th, 2024).

Source: tBTC Defi Volume Aggregate
#3.2.5 Slippage
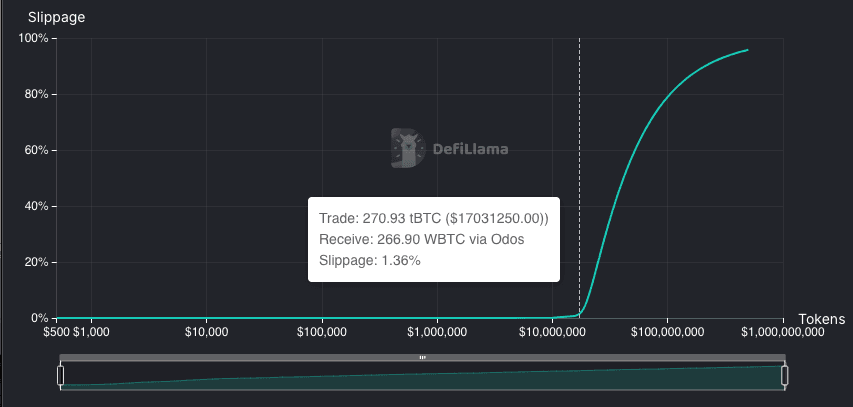
Since the initial report, slippage has remained relatively the same, with a trade of 270.93 tBTC resulting in 1.36% trade slippage for 266.90 WBTC as of May 13th, 2024.
Source: DefiLlama Liquidity Tool - May 13th, 2024
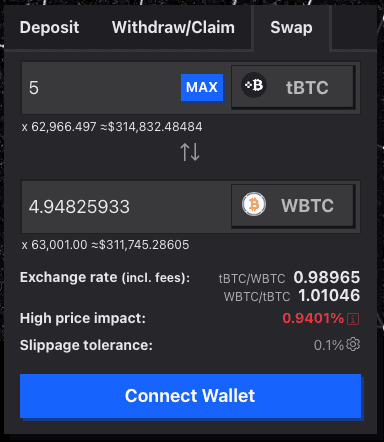
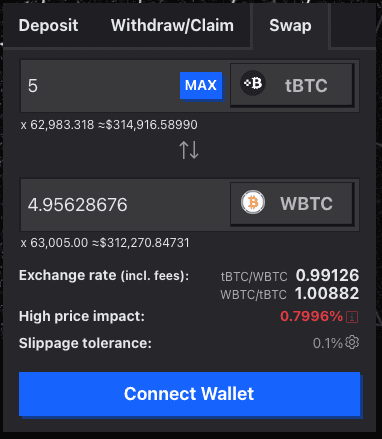
On Optimism and Arbitrum, the main liquidity pools (Curve) hold significantly less TVL, with a noteworthy price impact when swapping just five tBTC:
Source: Curve (Optimism), May 13th, 2024
Source: Curve (Optimism), May 13th, 2024
#Section 4 Technological Risk
#4.1 Smart Contract Risk
#4.1.5 Developer Activity
Weekly commits and developer activity over the last 90 days have remained relatively similar to the initial analysis. Active developers remain at most 4 (see bottom right frame). As mentioned in the initial analysis, this is likely still the core team.

Source: Artemis.xyz
#4.1.7 Previous Incidents
Previously, redemption was delegated to 1 approver address, which hindered the withdrawal process. Optimistic redemptions have since been implemented in v2.0.0 client app under this new system. Redemptions are deemed valid by default. However, specific addresses have the authority to veto any redemption.
Initially, selected Guardians will manually veto illicit redemption requests. However, this temporary solution will replace an automatic veto implementation.
#4.2 Product and Layer Composability
#4.2.1 Dependencies
Wormhole Integration
tBTC has recently integrated a decentralized cross-chain messaging protocol with Wormhole to transfer tBTC tokens across multiple blockchain ecosystems. This integration significantly expands tBTC's reach, allowing it to be used on over 20 chains, including Ethereum Virtual Machine (EVM) chains like Arbitrum and Polygon and non-EVM chains like Solana and Cosmos.
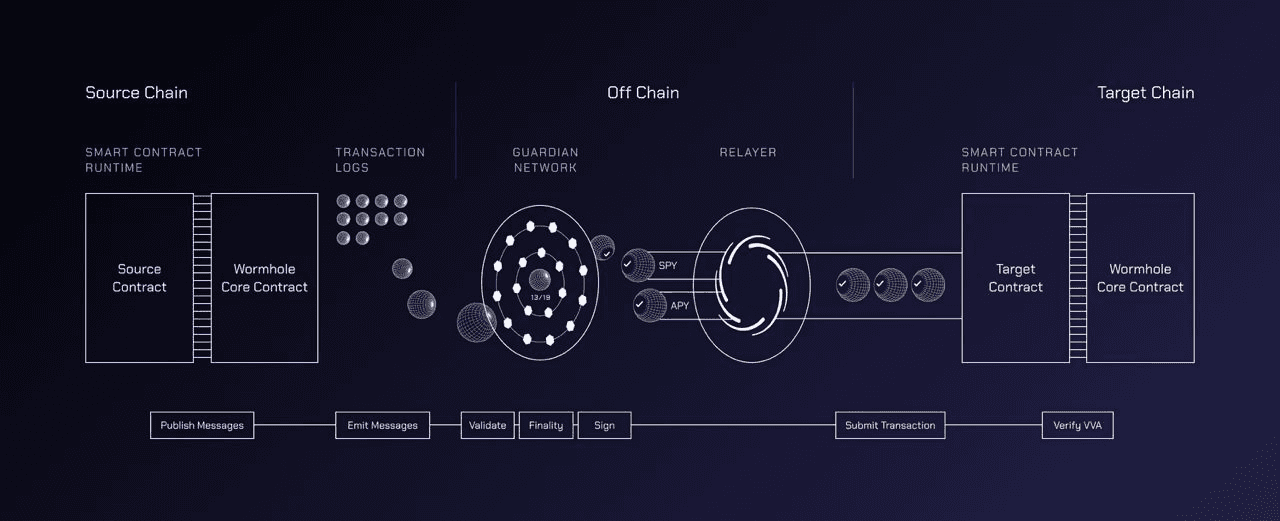
The Wormhole network relies on a distributed set of nodes called Guardians to verify and relay cross-chain messages. These Guardians observe the state of various blockchains and sign corresponding payloads, combined to form a multisignature proof known as a Verifiable Action Approval (VAA). This VAA attests that most of the Wormhole network has observed and agreed upon a specific state.
The L2WormholeGateway contract is a key component of the tBTC-Wormhole integration. This contract grants minting authority to the Wormhole Bridge for creating tBTC tokens on Layer 2 (L2) and sidechains. Users who want to transfer tBTC from Layer 1 (L1) to an L2 or sidechain lock their tokens in the bridge's smart contract on L1, wait for confirmation, and then mint equivalent tokens on the destination chain. The reverse process involves burning tokens on the L2 or sidechain, waiting for confirmation, and unlocking the original tBTC tokens on L1.
The L2WormholeGateway contract ensures that the proper amount of tBTC is minted or burned during the transfer process and is designed to be upgradeable through a transparent proxy. The integration has been deployed on multiple chains, including Arbitrum (ArbitrumWormholeGateway) and Optimism (OptimismWormholeGateway).
Source: Wormhole Documentation
While the Wormhole integration greatly enhances tBTC's cross-chain capabilities, it is essential to consider the potential risks associated with the Wormhole network and its Guardians. These risks, as identified by L2Beat for the Wormhole Portal, include:
-
Censorship: Guardians may decide to stop processing certain transactions, leading to the censorship of users.
-
Minting exploit: If Guardians allow more tokens to be minted than are held in escrow, it could affect holders' ability to redeem tBTC.
-
Fraudulent message signing: Guardians may sign fraudulent messages, allowing them to withdraw locked funds.
-
Malicious token contract upgrades: Funds could be stolen if a destination token contract is maliciously upgraded.
Users may only be exposed to Wormhole bridge risks if interacting with tBTC on L2 chains. These risks do not apply to tBTC on the Ethereum mainnet.
#4.3 Oracle Pricefeed Availability
#4.3.1 Understanding the Oracle
A Chainlink price feed has been introduced since our original report. The tBTC/USD contract was created on March 14th, 2024 and had a 2% deviation threshold or 24-hour heartbeat. The deviation threshold differs from ChainLink's BTC/USD feed, set at 0.5%. The current ChainLink adapter for WBTC on Aave V3 uses a combination of WBTC/BTC (2% threshold) and BTC/USD (0.5% threshold). In this context, the tBTC/USD price feed may compare favorably.
The price feed is currently categorized as a "Medium Market Risk" price feed. The Chainlink risk assessment indicates that the feed "delivers a market price for assets that show signs of liquidity-related risk or other market structure-related risk." This means that tBTC has enough historical data for Chainlink to conduct a sufficient risk assessment.
#4.3.2 Token Liquidity and Distribution
According to Dex Guru, liquidity distribution has diversified slightly over seven days (April 4th, 2024 - May 2nd, 2024) 5 days saw an average distribution ratio of Curve 76%: Uniswap 17%: Balancer 5%. The remaining 2 days presented a more narrow split between Curve 94% and Balancer 6%.

Source: Dex Guru
#4.3.3 Attack Vectors
Introducing a Chainlink price feed reduces dependency on the Curve pool EMA and exposure to pool manipulation/liquidity migration that would impact price reliability (see section 4.3.1).
#Section 5: Counterparty Risk
#5.1 Governance
#5.1.5 Participation
Since the initial analysis, voting has remained one-sided, with only 2 out of 15 Snapshot proposals receiving downvotes.
#Section 6: Risk Management
#6.1.4 Risk Rating
In updating our assessment of tBTC, we are revising our risk rating. Based on the risks identified for each category, the following chart summarizes a risk rating for tBTC as collateral. The rating for each category is ranked from excellent, good, ok, and poor.
-
We rank tBTC ok on liquidity (unchanged) since it remains a minor tokenized BTC asset. Its liquidity provision on DEX appears adequate, although listing on CEX (Kraken) needs more volume. The introduction of the Wormhole bridge has increased tBTC's availability across multiple chains, but Curve still holds the majority of liquidity and volume, albeit to a lesser extent since the initial analysis.
-
We rank tBTC good in volatility (unchanged) due to the permissionless ease of mints/redemptions that facilitate arbitrage, with a small fee on each action. tBTC has exhibited strong peg strength since redemptions were activated in July 2023.
-
We rank tBTC ok in smart contracts (unchanged) since there has been no change to its system architecture since deployment. The $500,000 ImmuneFi bug bounty program remains.
-
We rank tBTC good in dependencies as it has recently added a Chainlink oracle, reducing reliance on Curve EMA and permitting further DeFi integration. Significant off-chain processes that introduce complexity to the system remain a risk vector.
-
*We rank tBTC good in decentralization (unchanged) for prioritizing permissionless access, a decentralized bridge network, and a reasonably convincing pathway to on-chain governance.
-
We rank tBTC ok in legal (unchanged) as the legal structure(s) are domiciled in a prominent jurisdiction, while no enforcement actions against Threshold are evident. Clarifying the legal status of cross-chain bridges and fortifying the protocol's defenses could be better implemented.
Specific Consideration for Ethereum mainnet
Our previous assessment reviewed tBTC favorably, with moderate concerns about liquidity provisions and the lack of a dependable oracle. Considering liquidity provisions, holder distribution, and DeFi integration, tBTC is suitable for listing on Aave V3. The newly launched Chainlink price feed addresses the primary concern raised in the previous assessment by providing a dependable Oracle source.
The Ethereum mainnet remains the primary network for tBTC, holding the most significant share of the token's activity, despite the Wormhole bridge expanding tBTC's availability across multiple chains.
tBTC's liquidity on Ethereum is sufficient for listing on Aave V3, with a diverse set of liquidity providers. The token's volatility remains low due to the permissionless nature of mints and redemptions, which facilitates efficient arbitrage.
Although risks associated with the significant off-chain processes in the tBTC system persist, the overall risk profile has improved since the initial analysis. The Chainlink oracle, ongoing bug bounty program, and strong peg strength since July 2023 contribute to a favorable outlook for tBTC on the Ethereum mainnet.
In conclusion, we recommend listing tBTC on Aave V3 for the Ethereum mainnet, with appropriate risk parameters based on the token's liquidity, volatility, and overall market conditions.
Specific Consideration for Optimism and Arbitrum
Despite the recent growth in tBTC availability across multiple chains through the Wormhole integration, liquidity on Optimism and Arbitrum still needs to be increased to recommend onboarding. The main liquidity pool (Curve) holds significantly less TVL than Ethereum mainnet, with an important price impact for trades as small as five tBTC.
While tBTC has seen some volume on L2s, the overall liquidity profile is unimpressive and does not show strengthening growth trends. Positive trends in liquidity depth and utilization are necessary to minimize the creation of bad debt due to missed liquidations.
We do not recommend onboarding tBTC on Aave V3 for Optimism and Arbitrum networks.
