

A comparative performance analysis of common interest rate models available for use with LlamaLend, including Semilog, Piecewise Linear, and Time-based IRMs.
#1. Introduction & Motivation
Background: Semilog Monetary Policy is the current standard for calculating rates in LlamaLend markets. Semilog IRMs have historically been criticized for inflexibility and poor control around desired utilization levels. Prior research pinpointed insufficient curvature (due to how min_rate and max_rate were set) as a key limitation. To achieve the necessary curvature—so that rates rise rapidly after a target utilization—min_rate often has to be extremely low, which threatens adequate compensation for suppliers in normal market conditions.
Goal: This research evaluates alternative interest rate models (IRMs), building on discussions between LlamaRisk and Curve stakeholders about potentially superior IRM designs for future and existing implementations of LlamaLend. In doing so, we hope to identify a strong candidate for a default IRM that balances volatility, performance, and parameter simplicity.
#2. Method & Sample
#2.1 Candidate IRMs
The following IRMs were selected to conduct our experiment on the relative performance of different models.
-
Traditional Semilog: Used in LlamaLend markets, the borrow rate is a function of the min and max rate parameters and the market's utilization.

-
Quadratic & Cubic Iterations of Semilog: Variants extending the Semilog function class. There has been R&D on these variants, although none are currently used in production.


-
Piecewise Linear: A common interest rate model used in lending platforms like Compound and Aave composed of two linear functions joined by a "kink" at a specified target utilization.
-
rate when utilization < optimal utilization:

-
rate when utilization > optimal utilization:

-
-
Time-Weighted Variable Rate: A model used by FraxLend that uses a half-life parameter that adjusts the interest rate curve over time depending on the market's utilization around a target utilization.
Note: Other potential IRMs could be explored further, such as Variable Rate V2 from FraxLend or Morpho’s Adaptive IRM. These IRMs were not included in our experiments.
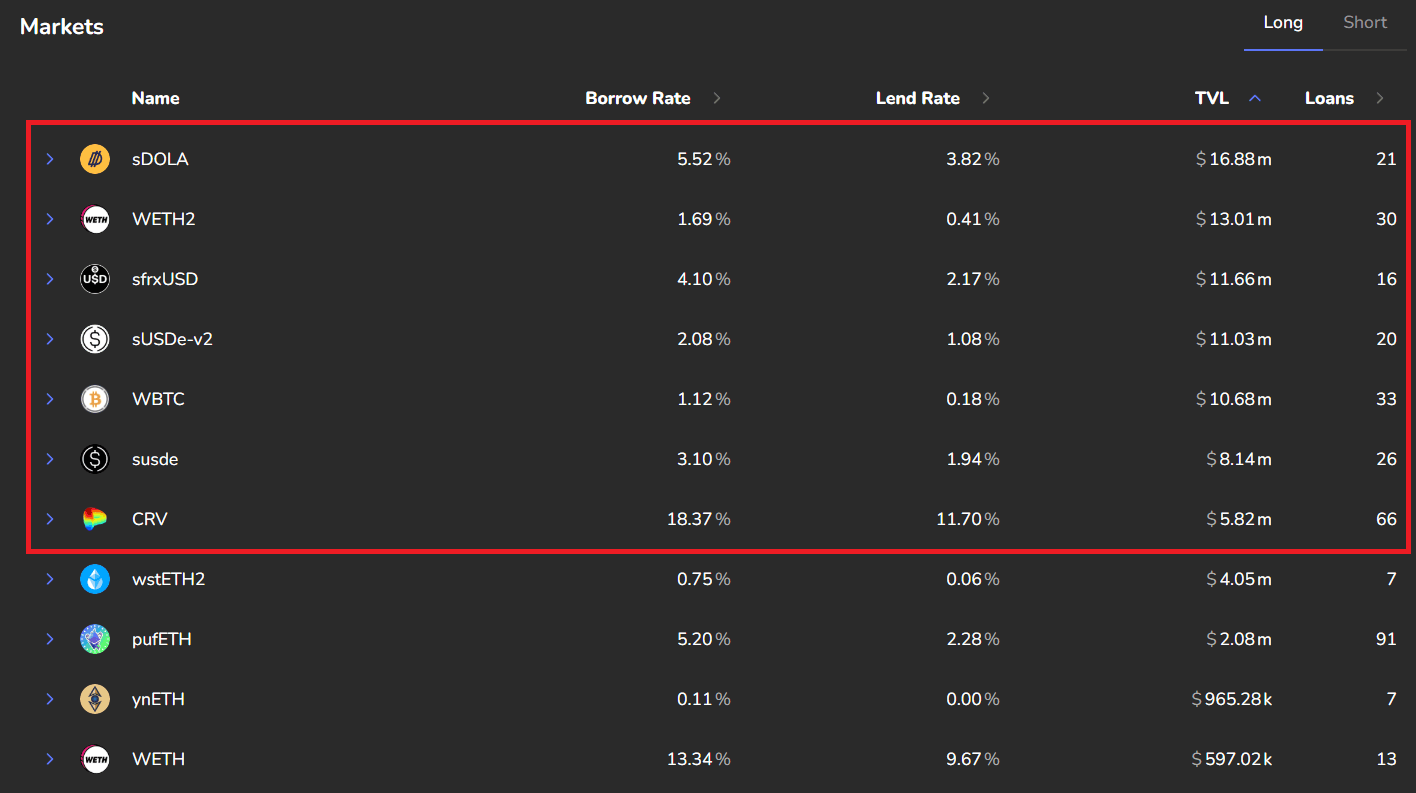
#2.2 Market Selection
We focus on LlamaLend markets with more than $5 million in TVL. A snapshot from 03/24/2025 yielded 7 such markets, but we excluded:
-
Arbitrum, Optimism, and Fraxtal: insufficient TVL.
-
sfrxUSD: recently deployed (Feb 27, 2025) with insufficient data.
This left 6 markets in the final sample:
#2.3 Optimality
We followed the optimization procedure for each market as detailed in our previous research on IRM optimization.
Yet, to succinctly summarize:
-
The Optimal Utilization Level of a Market is determined based on changes in
Total Assetsduring volatile periods. The rationale is to leave sufficient idle supplied assets to allow suppliers to withdraw. -
The Optimal Parameters for a given policy are determined by an optimizer using a weighted score across the evaluation metrics. The weight assigned to each evaluation metric determines the final parameter results.
#3. Results: Optimized Policies
#3.1 Overall Observations
Initial simulations demonstrated that Semilog, Quadratic, and Cubic formed one “family” of polynomial curves, while Time-Weighted Variable and Piecewise Linear constitute their own piecewise family. This is intuitive, given that the first three are continuous polynomial-like curves, whereas the latter two are stepwise or time-based.
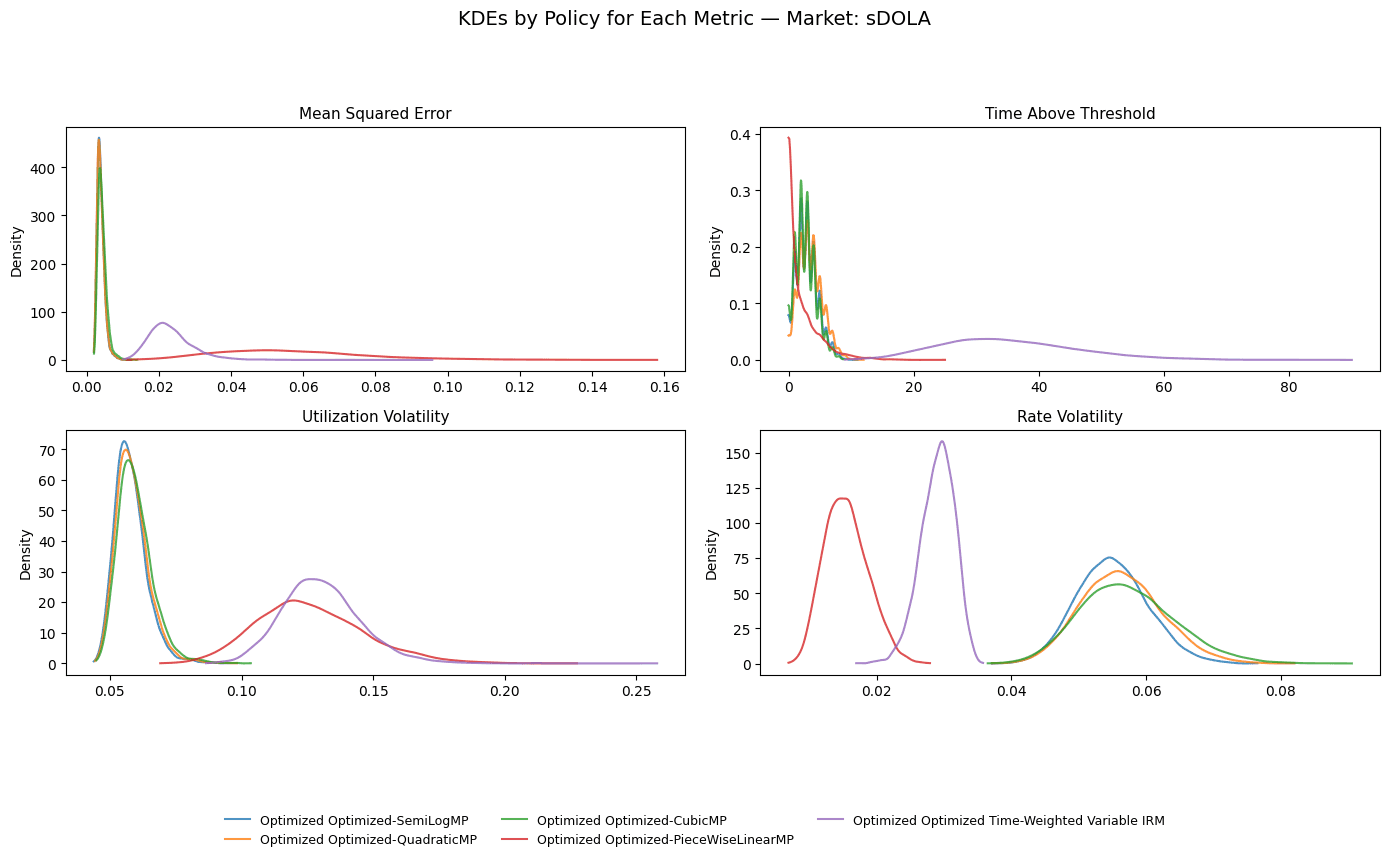
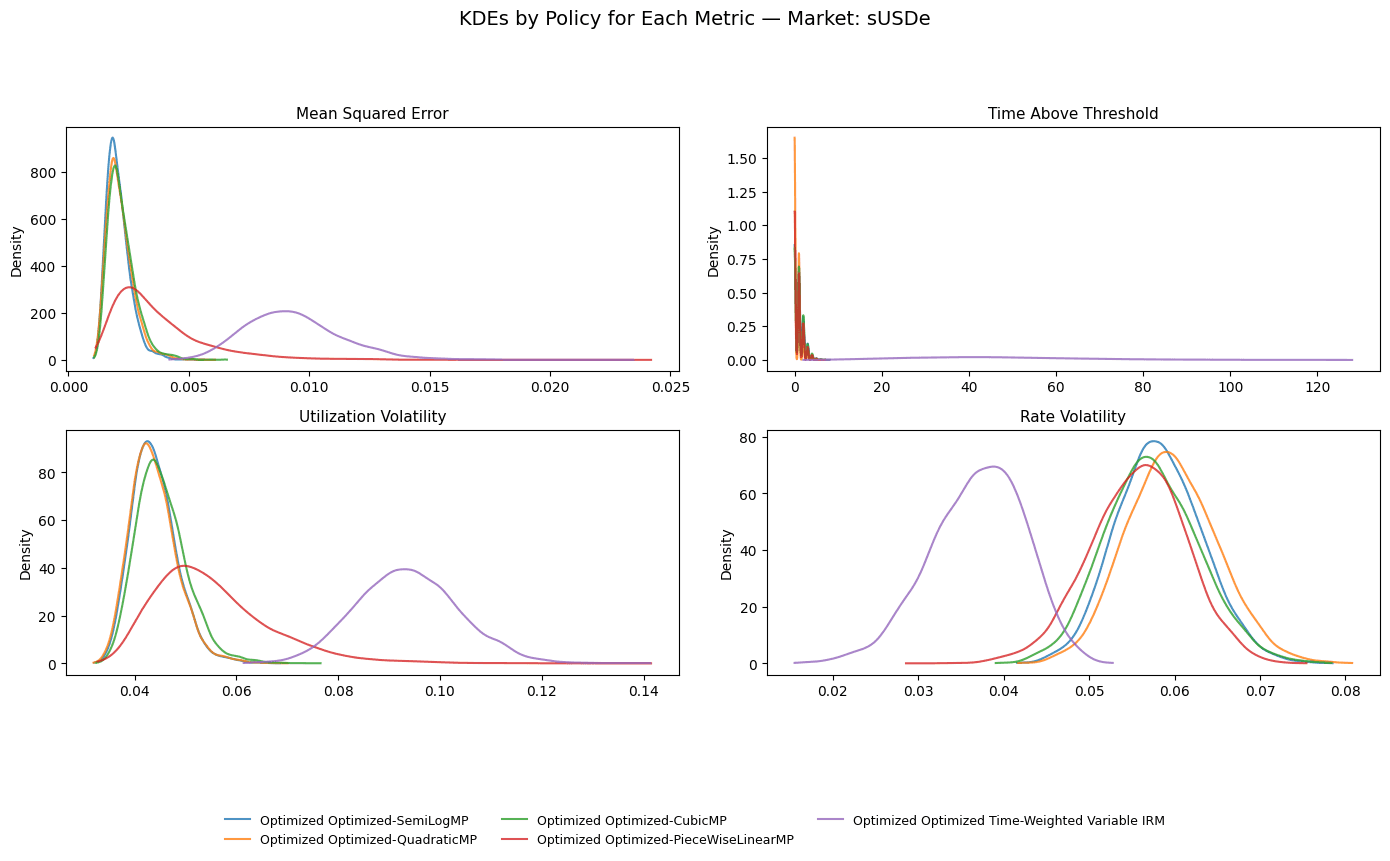
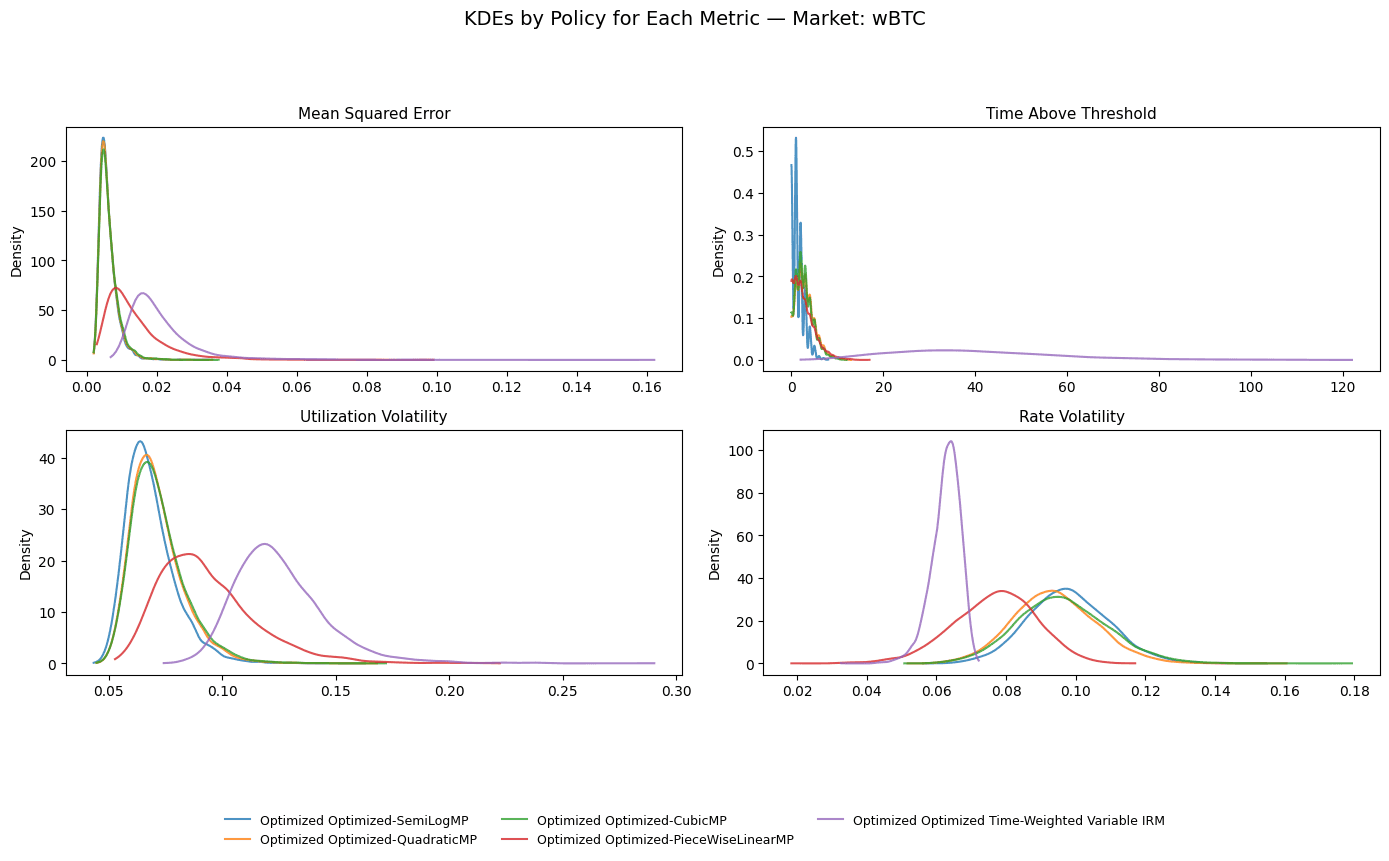
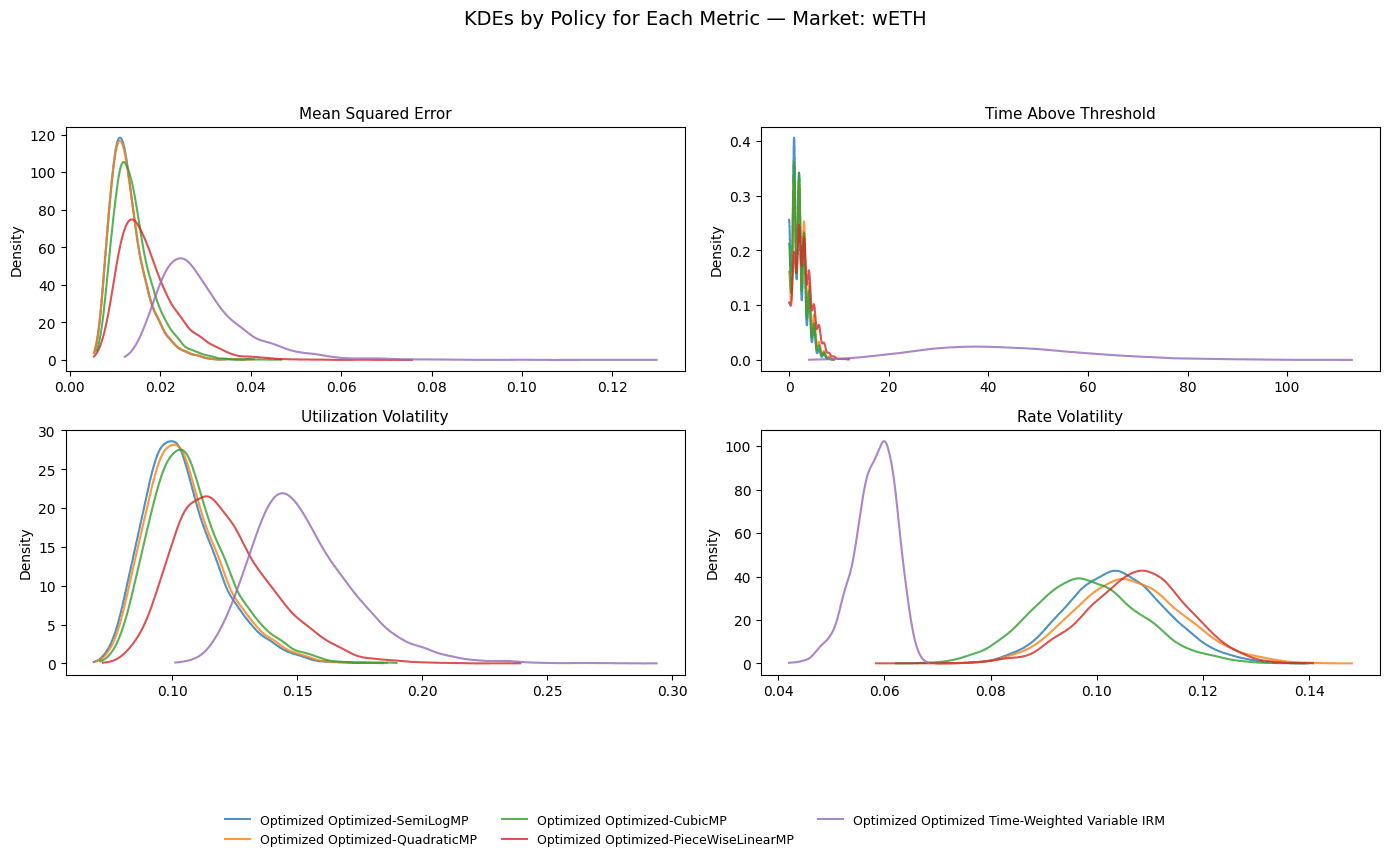
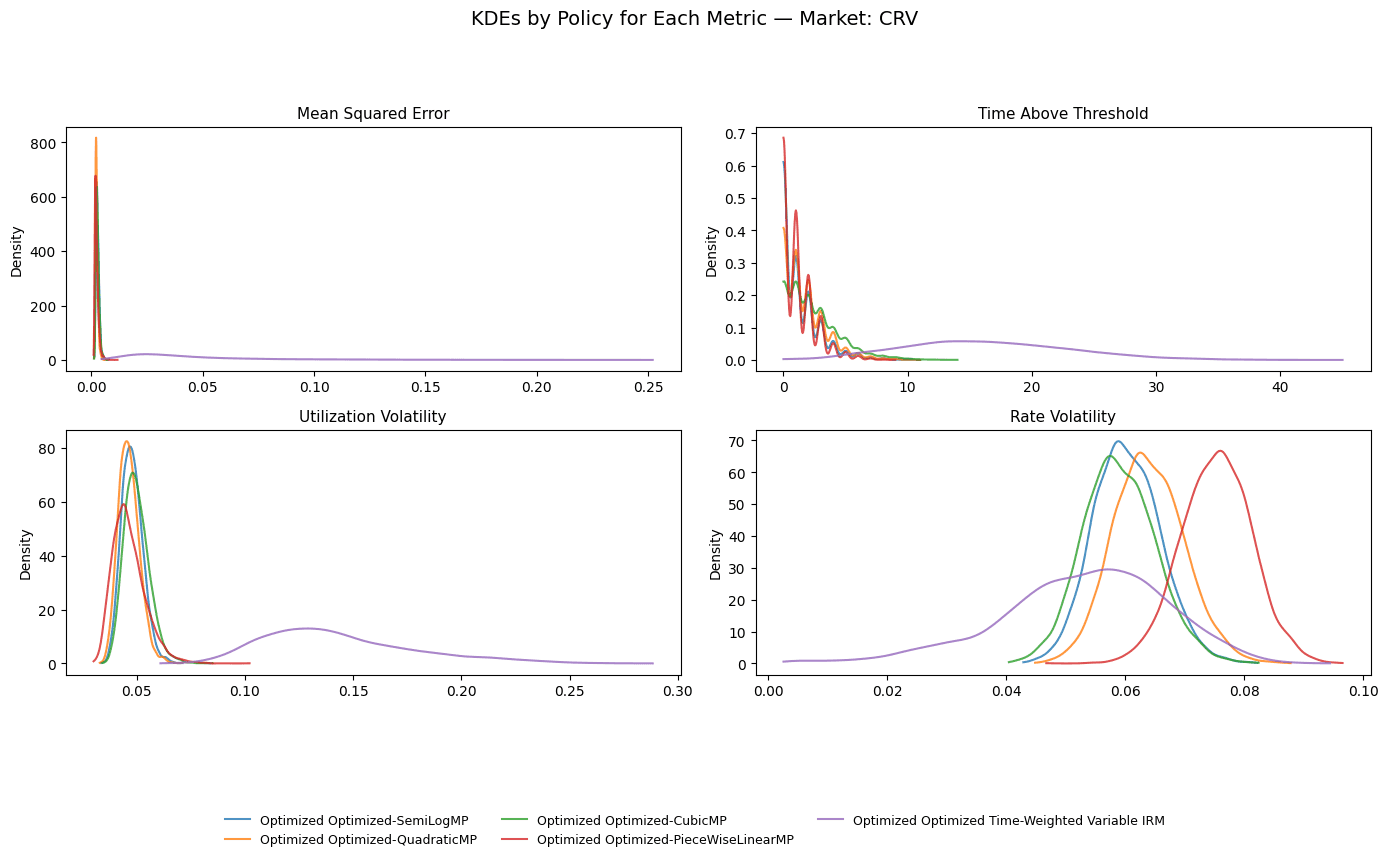
In the charts below, we simulated each target market with each IRM included in our study. We observe metrics about the market performance, including:
-
Mean Squared Error (MSE): This metric expresses how closely the market utilization operates relative to the target utilization, on average.
-
Time Above Threshold (TAT): How much time the simulated markets operate above the target utilization across the simulation run.
-
Utilization Volatility: The standard deviation in market utilization.
-
Rate Volatility: The standard deviation in market rate.
We seek to minimize the value of every metric; however, in practice, there tend to be trade-offs in selecting an optimization that balances each metric.
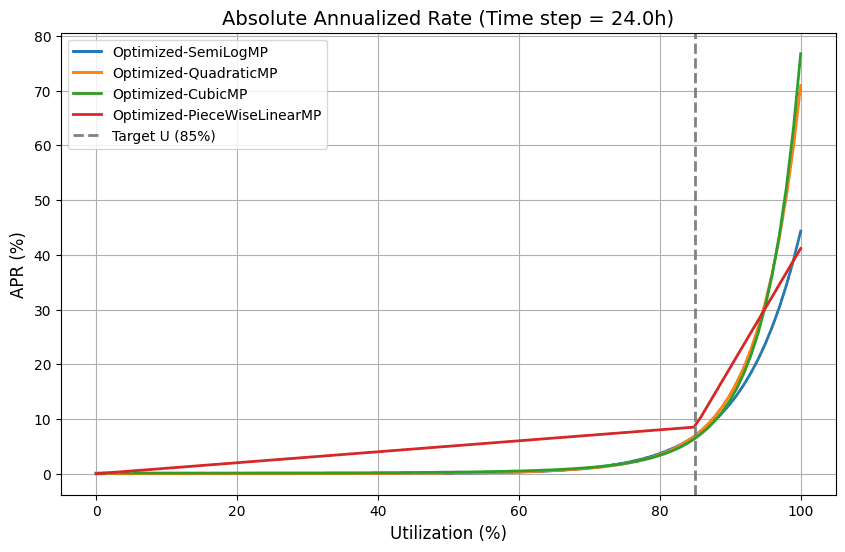
#sDOLA
IRM Plot:
Evaluation Metrics:
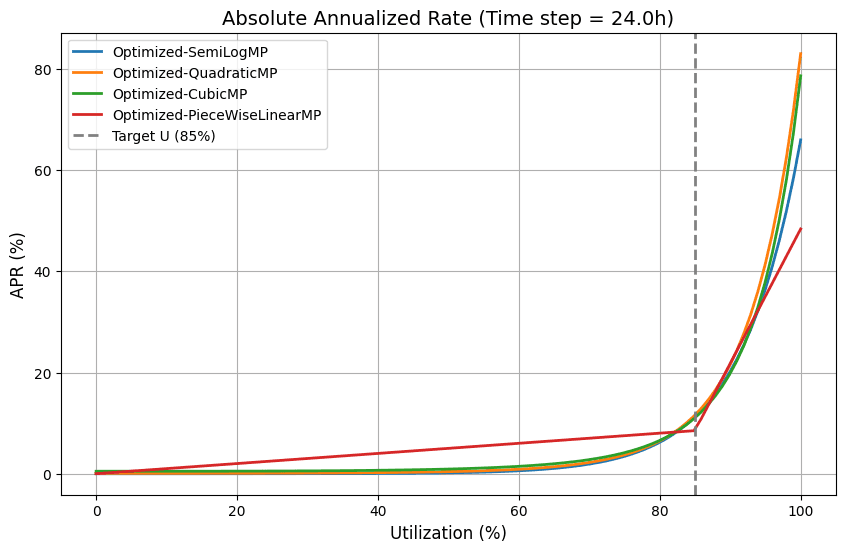
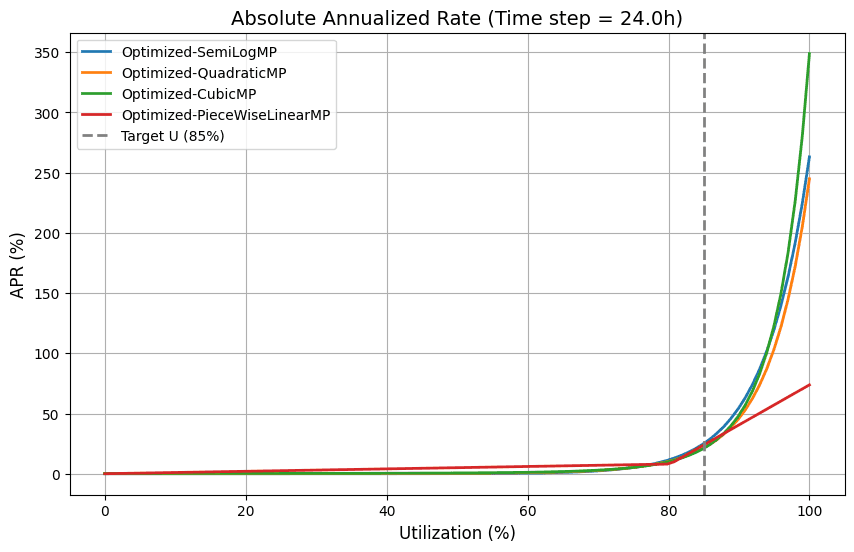
#sUSDe
IRM Plot:
Evaluation Metrics:
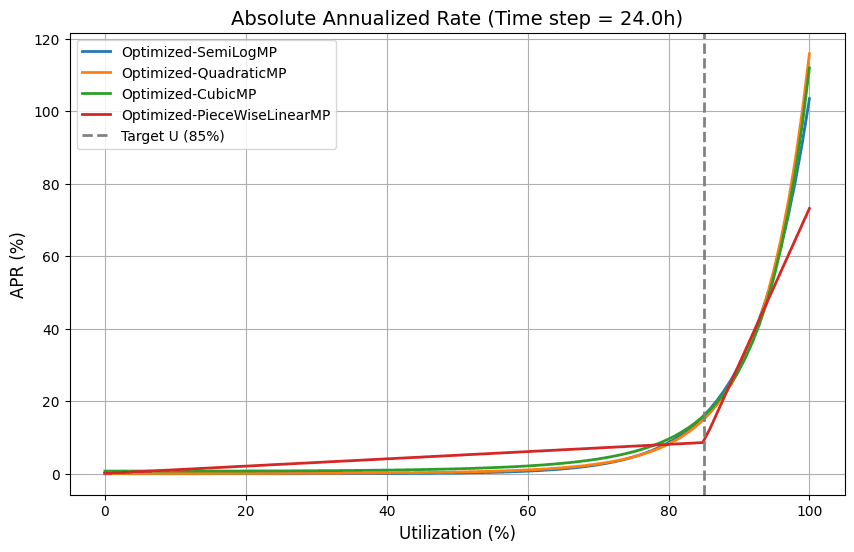
#WBTC
IRM Plot:
Evaluation Metrics:
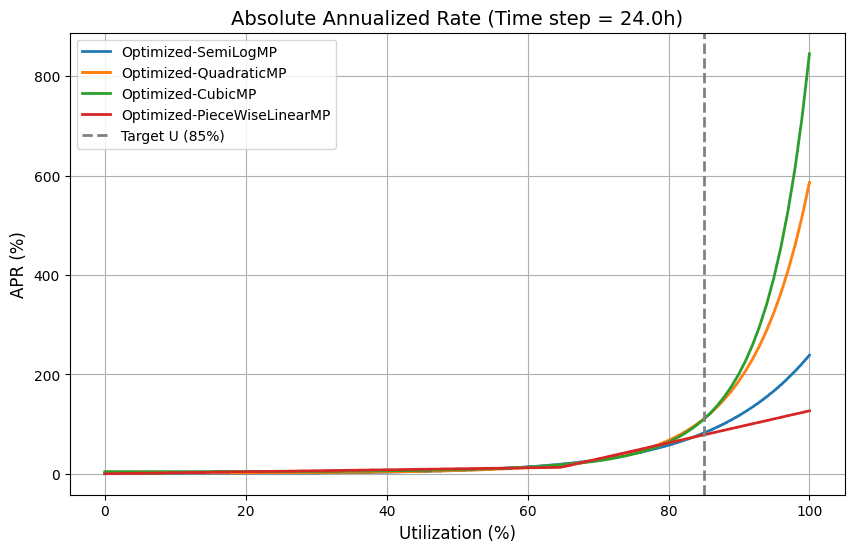
#WETH
IRM Plot:
Evaluation Metrics:
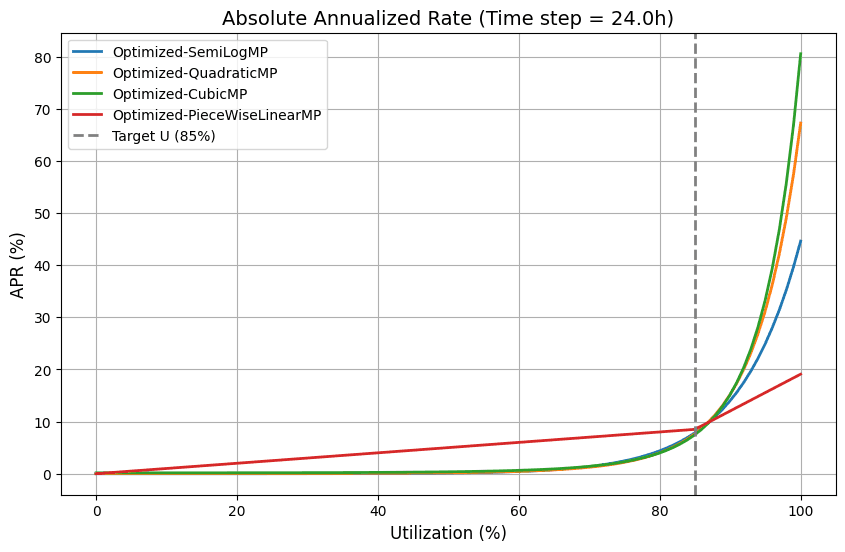
#CRV
IRM Plot:
Evaluation Metrics:
#USDe
IRM Plot:
Evaluation Metrics:
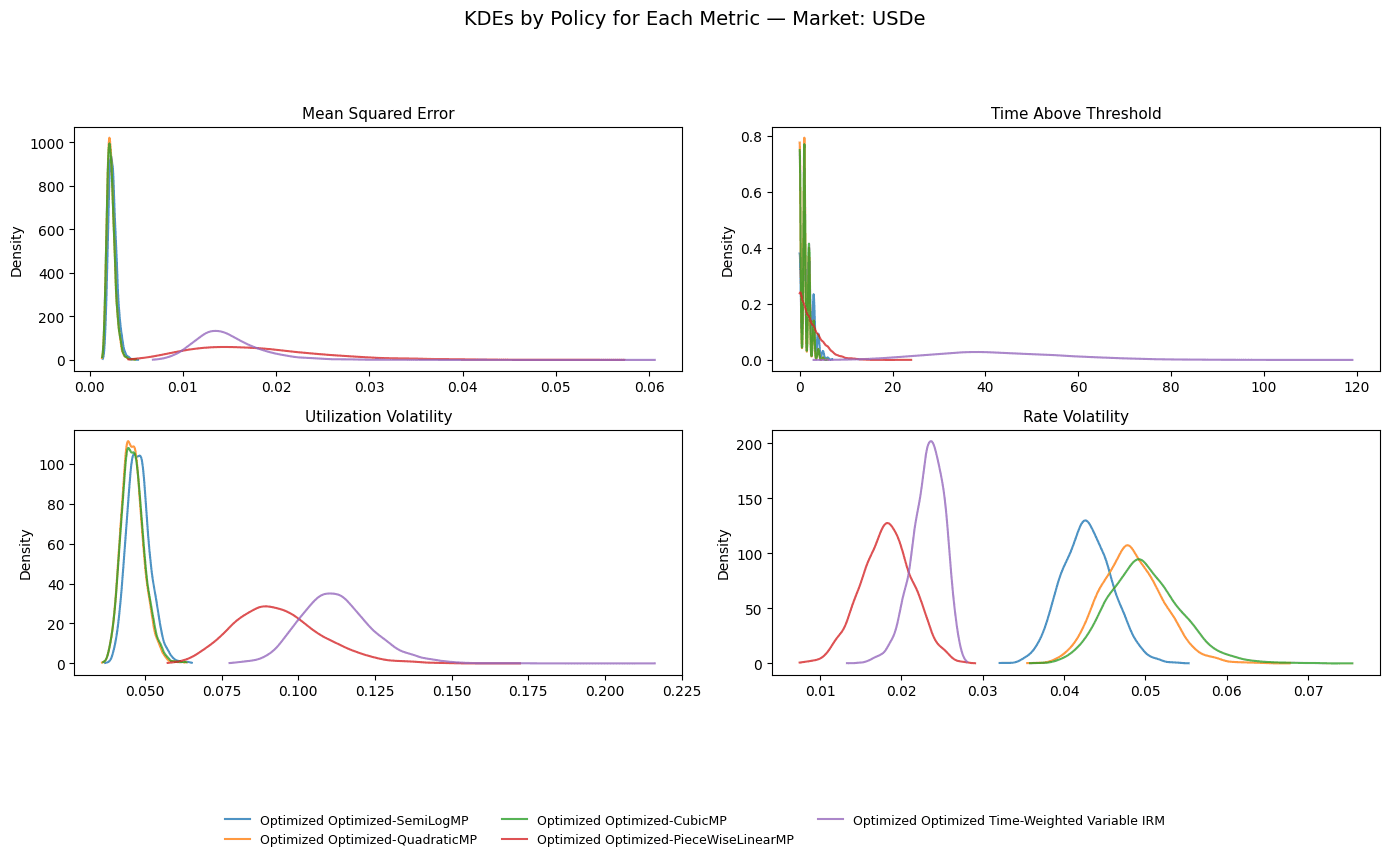
Note: The Time-weighted IRM is excluded in the plots above due to poor performance and difficulty in accurately comparing with utilization-based policies.
A quick look at the Mean Squared Error (MSE) displayed in the leftmost chart across the markets showed that Semilog, Quadratic, and Cubic generally outperformed the other polices in our sample. Thus, we narrowed our focus to those three and aggregated their values across all 6 markets:
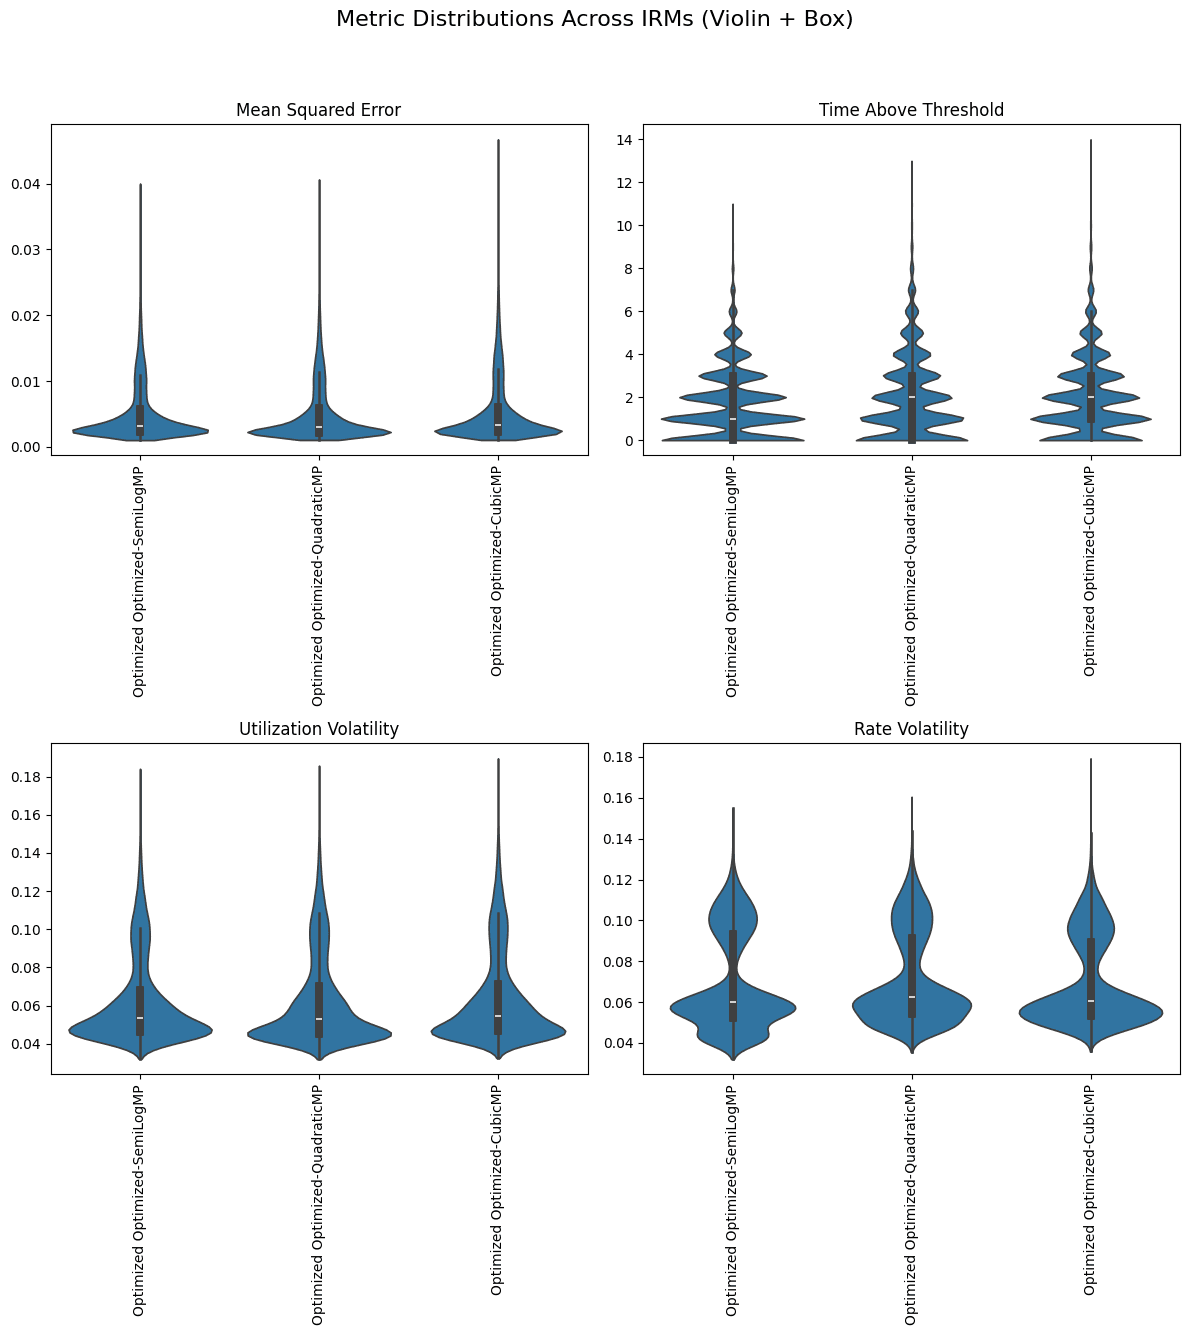
The differences in MSE among Semilog, Quadratic, and Cubic were marginal, with Quadratic showing a slight edge:
| IRM Label | Mean MSE | Std Dev | Median MSE | Min MSE | Max MSE |
|---|---|---|---|---|---|
| CubicMP (Optimized) | 0.00537 | 0.00485 | 0.00335 | 0.00106 | 0.04672 |
| QuadraticMP (Optimized) | 0.00500 | 0.00444 | 0.00307 | 0.00107 | 0.04064 |
| SemiLogMP (Optimized) | 0.00507 | 0.00435 | 0.00324 | 0.00104 | 0.04001 |
We also examined Rate Volatility across these IRMs:
| IRM Label | Mean Volatility | Std Dev | Median Volatility | Min Volatility | Max Volatility |
|---|---|---|---|---|---|
| CubicMP (Optimized) | 0.06971 | 0.02139 | 0.06051 | 0.03581 | 0.17931 |
| QuadraticMP (Optimized) | 0.07142 | 0.02246 | 0.06268 | 0.03547 | 0.16050 |
| SemiLogMP (Optimized) | 0.06970 | 0.02393 | 0.06017 | 0.03207 | 0.15481 |
The differences in volatility were minor, suggesting these three curves are effectively indistinguishable from each other within the noise of the simulation.
#3.2 Market-by-Market Parameter Analysis
Despite near-identical MSE and volatility, the best-fit (optimized) parameters varied. For example, Cubic IRMs frequently produced a higher rate_max, which can be advantageous for aggressively penalizing high utilization, hence punishing borrowers for not repaying. Such a configuration also offers suppliers stronger liquidity assurances during anomalous market scenarios. Below are a few highlights:
-
CRV Market
Target utilization is very low, so rates escalate quickly after ~80%.IRM rate_min rate_max SemiLogMP 0.00192 2.38755 QuadraticMP 0.01429 5.86205 CubicMP 0.04232 8.45544 -
sDola Market
IRM rate_min rate_max SemiLogMP 0.000002 0.59614 QuadraticMP 0.00014 0.65141 CubicMP 0.00124 0.78802 -
wETH Market
IRM rate_min rate_max SemiLogMP 0.000005 1.03494 QuadraticMP 0.00073 1.15900 CubicMP 0.00723 1.11989
Across multiple markets, higher-order Semilog (Quadratic/Cubic) IRMs delivered an appealing combination of:
-
Higher base compensation for suppliers (i.e., not forcing
rate_minto be near zero). -
Steeper penalties for borrowers once utilization exceeds the target threshold.
#4. Critique & Additional Analysis
#4.1 Separate Questions in Play
The prior experiment addresses two different questions:
-
A) What are the optimal parameters for a given policy?
-
B) What is the best default policy?
The weights used in the optimizer may not generalize well across policies. For example, Piecewise Linear might require a different emphasis on Mean Squared Error (MSE) than Semilog. This could distort comparative performance and lead to misleading conclusions. Right now, our optimizer is tuned to accommodate polynomial-based policies.
To answer whether Piecewise Linear function is indeed inferior, we make an unoptimized comparison, isolating it to the relative performance of similar IRM policies.
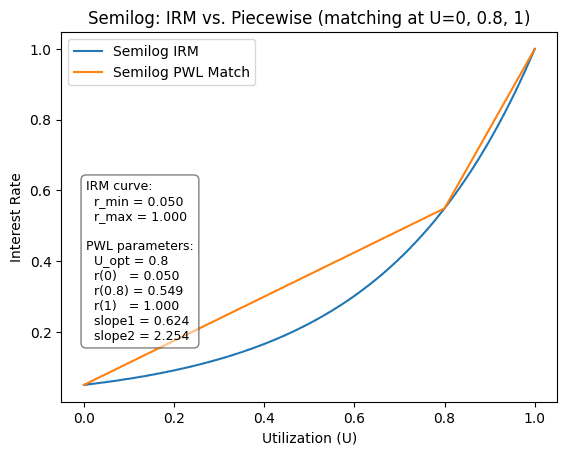
#4.2 Unoptimized Comparison
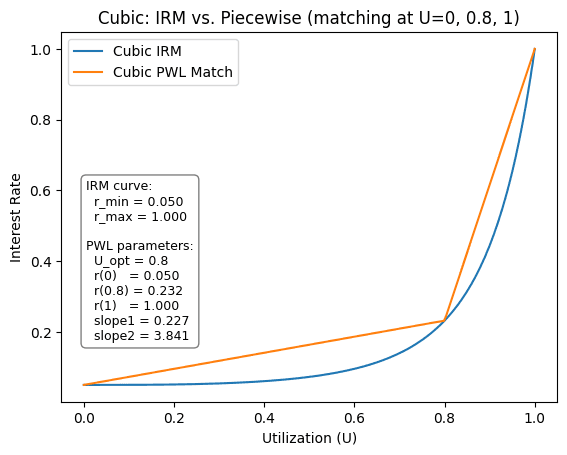
To isolate inherent shape differences, we tested Piecewise Linear vs. Semilog/Quadratic/Cubic on a single market (WBTC-long) by trying to replicate the polynomial curves with a comparable Piecewise Linear. In order to do so, we match Piecewise Linear parameters in such a way that both policies share the same starting point, end point, and the same rate at optimal utilization. The parameters for this market are rather arbitrary. We chose the following parameters:
-
**Optimal Utilization**: 80% -
**rate_min**: 5% -
**rate_max**: 100%
However, for the scope of the experiment, this should be acceptable given that we are not interested in absolute performance, but rather the relative (even if poor) performance of each policy.
The figures below show the experimental setup:
Semilog:
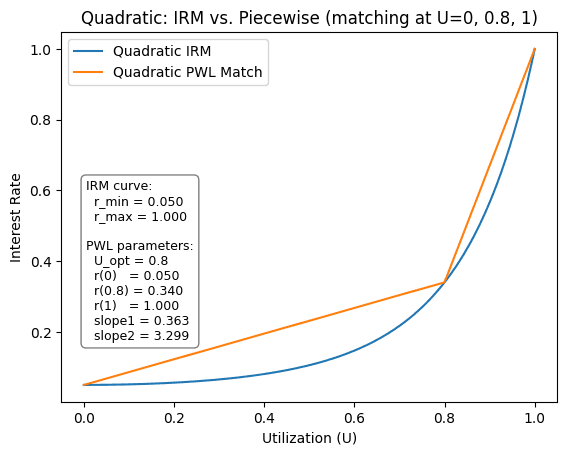
Quadratic:
Cubic:
Results: Let's analyze the results - here we purely focus on the relative performance of the policies:
-
Semilog: We see a clear difference that the Fixed-Piecewise Linear Function has a higher MSE and a slightly higher rate volatility. This indicates that Semilog seems to be performing better.
-
Quadratic: The quadratic iteration basically paints an identical picture to the Semilog vs Piecewise Linear, except that the difference between the MSE of the quadratic and the Piecewise Linear seems to be greater, and the volatility of the Quadratic approaches a similar level to the Piecewise Linear.
-
Cubic: Similarly, the cubic implementation of the Semilog policy performs in line with Quadratic and Semilog implementations relative to the Piecewise Linear. Yet, the MSE divergence between them increases even further, and the Rate volatility exceeds that of the comparable Piecewise Linear.
Overall, when substituting a Piecewise Linear IRM under the same configuration of (rate_min, rate_max, optimial_utilization) it seems to manage rates worse, even if rate volatility is comparable. This corroborates earlier findings that polynomial curves seem better at managing markets.
#5. Conclusion & Recommendation
#5.1 Summary of Findings
-
Continuous Curves Outperform
Semilog, Quadratic, and Cubic IRMs consistently manage utilization more smoothly, demonstrating lower MSE than Piecewise Linear or Time-Weighted Variable Rate. -
Quadratic vs. Cubic vs. Semilog
-
Semilog is simple and the standard used in existing markets.
-
Quadratic offers slightly finer control without undue complexity.
-
-
Cubic provides the steepest penalty at high utilization, allowing higher
rate_maxwhile keeping a moderaterate_min.
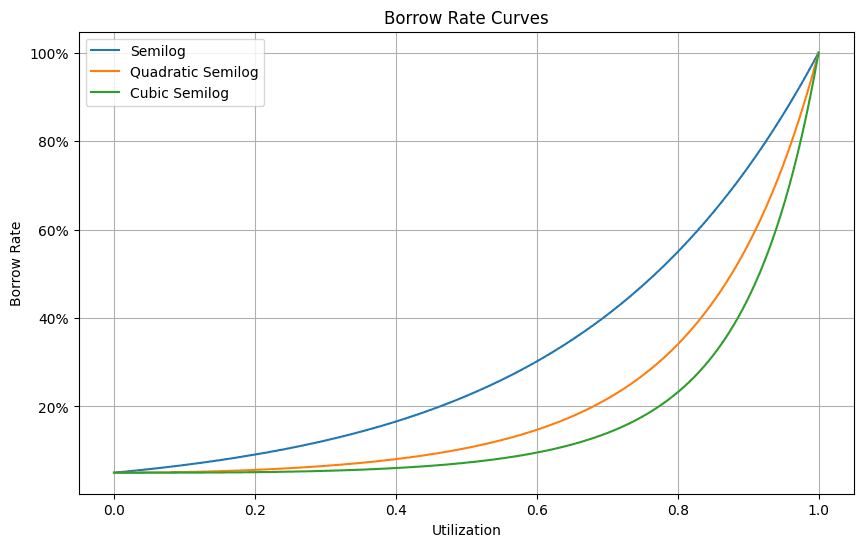
Illustrative example of each curve with _min_rate_=5% and _max_rate_=100%
- Piecewise Linear
Even with matched endpoints and target utilization, the abrupt slope changes lead to poorer MSE performance without clear volatility benefits, making it less attractive as a universal default.
#5.2 Final Recommendation
We recommend Llamalend to adopt a single continuous IRM. We suggest the quadratic policy as the default policy for LlamaLend V2.
We recommend adopting a quadratic iteration for three reasons:
-
Marginally performs better in comparison to other polynomial-based curves.
-
Offers better rates to suppliers while being more reasonable (less explosive) when utilization nears 100%. This helps to subdue excessive rate volatility during normal market operation.
-
Demonstrably outperforms or equals Piecewise Linear in head-to-head comparisons with the same volatility level while achieving a lower MSE.
Note: Existing markets on a Semilog policy likely do not warrant an immediate transition, as Semilog is still in the same family and performs sufficiently well. However, for new markets or major upgrades, Quadratic IRMs are recommended for the most robust default behavior.